Original Link: https://www.anandtech.com/show/1486
Building a Better (Linux) GPU Benchmark
by Kristopher Kubicki on September 24, 2004 12:05 AM EST- Posted in
- Linux
Introduction
For those who follow our Linux reviews, we have made a lot of headway in the last two months. Our benchmarking has improved, our graph engine is top notch and we are working closely with all the major manufacturers to bring a definitive resource for Linux hardware to our readers. Today, we want to introduce everyone to our GPU Linux benchmarks and how we will run them in the future. This isn't a comparative analysis yet, but we won't keep you waiting long for that.The adherent flaw with any benchmark is that you, the reader, only receives a sampling of data - engineers and statisticians alike call this "data compression". When we sample data from a timedemo and format it into an average frames per second, we lose all sort of valuable data, such as what the lowest frames per second was, what the highest was, when the largest dip in FPS had occured, what the image looked like, and the list goes on. There have been a few attempts to convey more than just an average FPS in video benchmarks, most notably with FRAPS. FRAPS does not entirely address the issue of reproducibility and FRAPS runs on Windows only.
Fortunately, we have been graced with some very talented programmers who worked with us to build a benchmarking utility similar to FRAPS (on Linux) that we may eventually port over to Windows as well. Consider this to be our experiment in advancing our benchmarking methods while using Linux as our guinea pig. Eventually, we anticipate releasing the benchmark complete with source to the public.
Here is how our utility works, as explained by the lead developer, Wiktor Kopec.
"The program computes frames per second for an application that uses OpenGL or SDL. It also takes screenshots periodically, and creates an overlay to display the current FPS/time.You can read more about SDL and OpenGL. SDL is a "newer" library bundled with most recent Linux games (Medal of Honor: AA, Unreal Tournament 2004). In many ways, SDL behaves very similarly to DirectX for Linux, but utilizes OpenGL for 3D acceleration.
"This is accomplished by defining a custom SwapBuffers function. For executables that are linked to GL at compile time, the LD_PRELOAD environment variable is used to invoke the custom SwapBuffers function. For executables that use run-time linking - which seems to be the case for most games - a copy of the binary is made, and all references to libGL and the original glXSwapBuffers function are replaced by references to our library and the custom SwapBuffers function. A similar procedure is done for SDL. We can then do all calculations on the frame buffer or simply dump the frame at will."
Why Average Frames Per Second Can Be Misleading
Timedemos make up the core backbone of our video card benchmarks. Timedemos are simply pre-recorded scenes that are re-rendered as the program plays them back. The example that we use here is the timedemo "radar" from the game Wolfenstien: Enemy Territory. Depending on the conditions of the testbed, radar might render more or less frames than another machine, but both machines will always take the same amount of time to play back. The program generally reports the number of frames rendered and we divide by the number of seconds that the timedemo lasted. This calculates our average frames per second.Plotting more than just the average FPS is not a new concept. AMD, Intel, NVIDIA and ATI have all expressed their thoughts to us about plotting box-and-whisker or line graphs of our timedemos rather than just an average FPS. Of course, CPU manufacturers do not like timedemos at all, but that is an argument that we will leave for a different day. Let us claim during our timedemo that we record the instantaneous frames per second several times. "Instantaneous" may be a bit of a misnomer if you do not have an explicit math background, but for argument's sake, let's say that we are calculating how many frames we render in exactly one second and plotting those FPS over the course of a minute. The graph may look something like this.
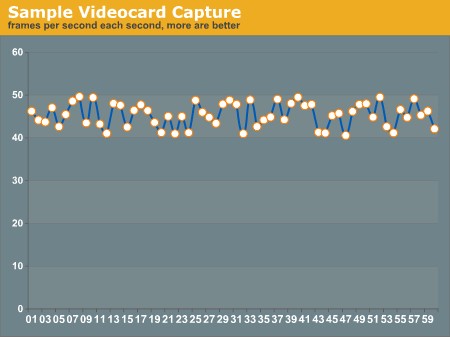
This line graph demonstrates a 60-second clip from a timedemo with 45 average frames per second. When we look at an average FPS, we expect the timedemo's instantaneous frames per second to look something like this. In reality, the timedemo may look something more like this extreme example below.
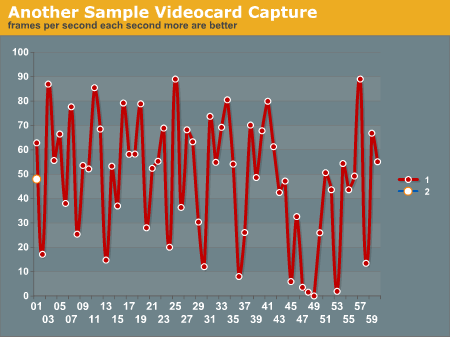
Both graphs have an average ~45 frames per second. In fact, the lower graph actually averages to slightly higher. We make written notes of issues like this in our Windows GPU analyses, but a line graph puts it into a format that is less subjective.
Some Test Cases
Our new benchmark wouldn't be very useful if we didn't have any test cases, would it? As we mentioned on the previous page, the average frames per second of a game might not reflect accurately what occurs in the game, even if the average results are very higher. Please note that we are anticipating a full benchmark of almost a dozen ATI and NVIDIA cards in the next few weeks - this is just a sample of what our benchmark utility is capable of. Both graphs below are taken with the same "radar" Wolfenstien radar timedemo.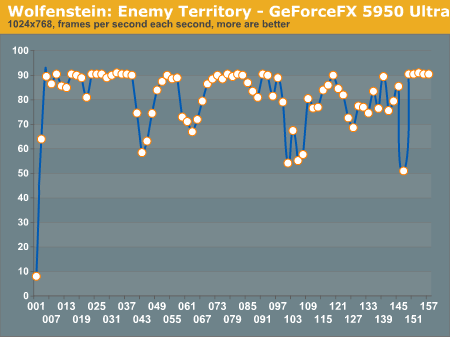
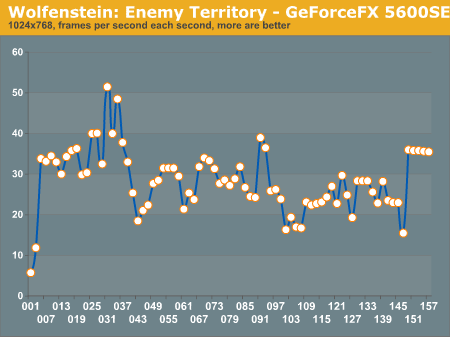
The graph below is just an overlay of the above two graphs.
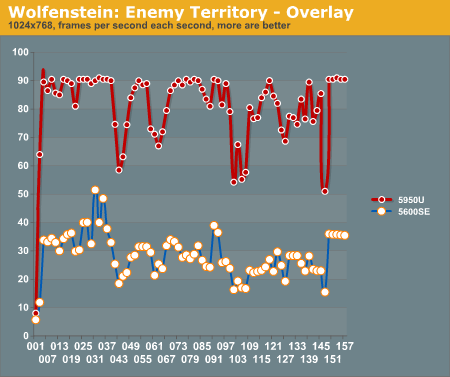
We can really see those dips in the graphs where some IO is occurring and bogging down the graphic cards. We have observed much unusual phenomenon on some of these demo graphs. One thing that we can immediately digest from the 5950 Ultra graph is the 90FPS ceiling - the card is more capable, but Wolfenstien is configured to limit the video card at 85FPS. Notice also that around the 73rd second, the FX5600 hits a local minimum while the FX5950 hits the 85FPS ceiling. We will discuss these sorts of details more with the preliminary video card roundup.
Oh, yes, and of course, we have this graph to show you too.
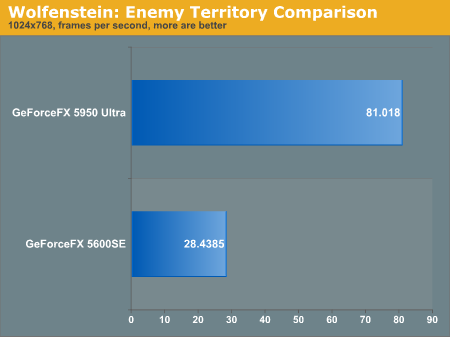
Average FPS graphs are fine, but if we really want to convey some thorough and hard data sampling, we have to use average FPS in conjunction with line plots.
IQ Testing
To go further along the lines of the extreme "Average" frames per second scenario, we also need to consider Image Quality. Do we really want to play a game that runs faster on one card than another if it has poor shading techniques or unknowingly (or knowingly?) clips lighting effects? ATI and NVIDIA have both been batted around over "Optimziation" issues. Although the optimization accusations are more or less behind us now, a particular graphics manufacturer will release drivers soon that purposely enable optimizations (but will force you to enable them yourself). As new extra-tweaked driver sets begin to take advantage of these new open optimizations, knowing the image quality between different graphics cards becomes much more critical.Again, we were extremely blessed with some very bright coders fully capable of abusing every last ounce of the OpenGL and SDL libraries. Below, you can see two side by side images of NVIDIA graphics cards captured at the same frame. On the top is a GeForce FX 5950 Ultra with single pass lighting, and on the bottom is the same card with multipass lighting on low quality. Click to enlarge either image.

Click to enlarge.

Click to enlarge.
Notice that these frames are slightly different. We have one or two bugs to work out in the frame capture program. In any case, we can still make some comparisons. All of our sample frames are captured in a lossless format similar to BMP, and then compressed with another lossless codec, PNG.
|
|
|

The lighting and textures speak volumes alone. Granted, these are extreme cases that we should not see from card to card. When it comes to comparing different card architectures, these are the kind of comparisons that we will take.
Final Words
Hopefully, you feel that our approach to benchmarking Linux games is an improvement over traditional methods. We have put a lot of work into preparing this new utility, and we will continue to perfect it in the future as well. The point here is not to eliminate our old benchmarks, but to augment average frames per second with thorough IQ and time-delimited data to give readers a better way to judge which products are better.And of course, be prepared for our massive Linux GPU roundup in the coming weeks.


