Original Link: https://www.anandtech.com/show/13672/the-seagate-barracuda-500gb-ssd-review
The Seagate BarraCuda (500GB) SSD Review: Getting Back In The Game
by Billy Tallis on December 7, 2018 8:00 AM EST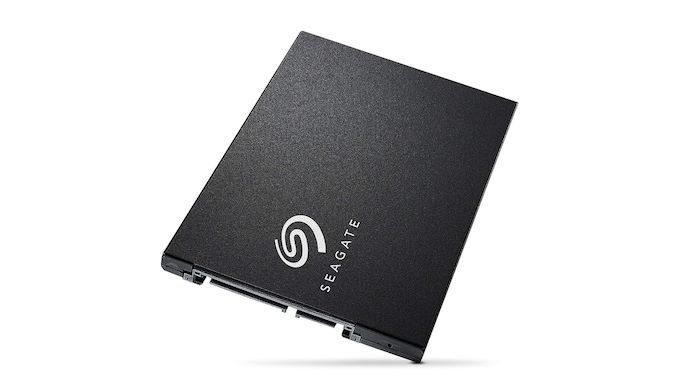
Earlier this year, Seagate re-entered the consumer SSD market with their BarraCuda SATA SSD. It's been over five years since we last reviewed a Seagate consumer SSD, so for all practical purposes this is a fresh start for the company.
Seagate has been one of the top names in the storage industry for decades, but it's almost exclusively for their hard drives. The company has been largely absent from the consumer SSD market, and their enterprise SSDs have never particularly stood out above the competition. By comparison, rival Western Digital managed to acquire SanDisk and with it a 50% stake in one of the largest NAND flash manufacturers. Seagate's acquisitions have been less fruitful: they bought controller designer SandForce right around when SandForce drives disappeared from the market for good. Since then, Seagate has had to buy controllers and NAND on the open market and provide product differentiation through firmware or by integrating their drives into storage appliances.
The Seagate BarraCuda is not a revolutionary new SSD. It doesn't mark the release of a new SandForce controller but instead uses the very familiar and rather old Phison S10 controller. The flash is Toshiba's 64-layer 3D TLC NAND. Toshiba for their past has technically already started shipping their 96-layer TLC, but most of their production is still 64L and the 96L NAND hasn't made it into any retail SSDs yet, so the BarraCuda is up to date on the NAND choice.
This is the first drive we've tested that pairs the Phison S10 controller with 3D NAND. We first reviewed this controller in 2014, so it has had an incredibly long lifespan for such a product. With the SATA interface no longer getting speed increases, the Phison S10 isn't as obviously outclassed as such an old controller would otherwise be. It's showing its age a bit with the lack of LDPC error correction or (LP)DDR4 support, but it has proven to be an adaptable chip, supporting several generations of planar NAND and staying relevant today with support for 3D NAND. It also supports SSD capacities of up to 2TB, which was extremely implausible for a consumer drive with the flash prices in 2014, but which are now available for less than $300.
| Seagate BarraCuda SSD Specifications | ||||||
| Capacity | 250 GB | 500 GB | 1 TB | 2 TB | ||
| Form Factor | 2.5" 7mm SATA | |||||
| Controller | Seagate-branded Phison S10 | |||||
| NAND Flash | Toshiba 64L 3D TLC | |||||
| DRAM | Nanya DDR3-1600 CL11, 1.35V | |||||
| Sequential Read | 560 MB/s | |||||
| Sequential Write | 530 MB/s | 535 MB/s | 540 MB/s | 540 MB/s | ||
| Random Read | 90k IOPS | |||||
| Random Write | 90k IOPS | |||||
| Power | Active | 2.6 W | 2.6 W | 2.8 W | 3.1 W | |
| Idle | 185 mW | 192 mW | 221 mW | 225 mW | ||
| DevSleep | 5 mW | |||||
| Warranty | 5 years | |||||
| Write Endurance | 120 TB 0.26 DWPD |
249 TB 0.27 DWPD |
485 TB 0.27 DWPD |
1067 TB 0.29 DWPD |
||
| Current Retail Price | $52.99 (21¢/GB) | $84.99 (17¢/GB) | $149.99 (15¢/GB) | $349.99 (17¢/GB) | ||
The specifications for the Seagate BarraCuda look about the same as any other mainstream SATA SSD these days: TLC NAND, sequential I/O performance that mostly saturates the SATA link, and random I/O performance at up to 90k IOPS. But real-world performance depends more on performance at low queue depths and on mixed workloads, not peak numbers at QD32. This is where newer SSD controllers may have an edge over the Phison S10.
The BarraCuda is rated for a little under 0.3 drive writes per day over the duration of its 5-year warranty. We can be pretty sure that the controller can keep going that long because our earliest Phison S10 drives closing in on that age without problems. However, without the benefit of LDPC error correction, Seagate's write endurance rating isn't as conservative as the 0.3 DWPD we see on its competition.
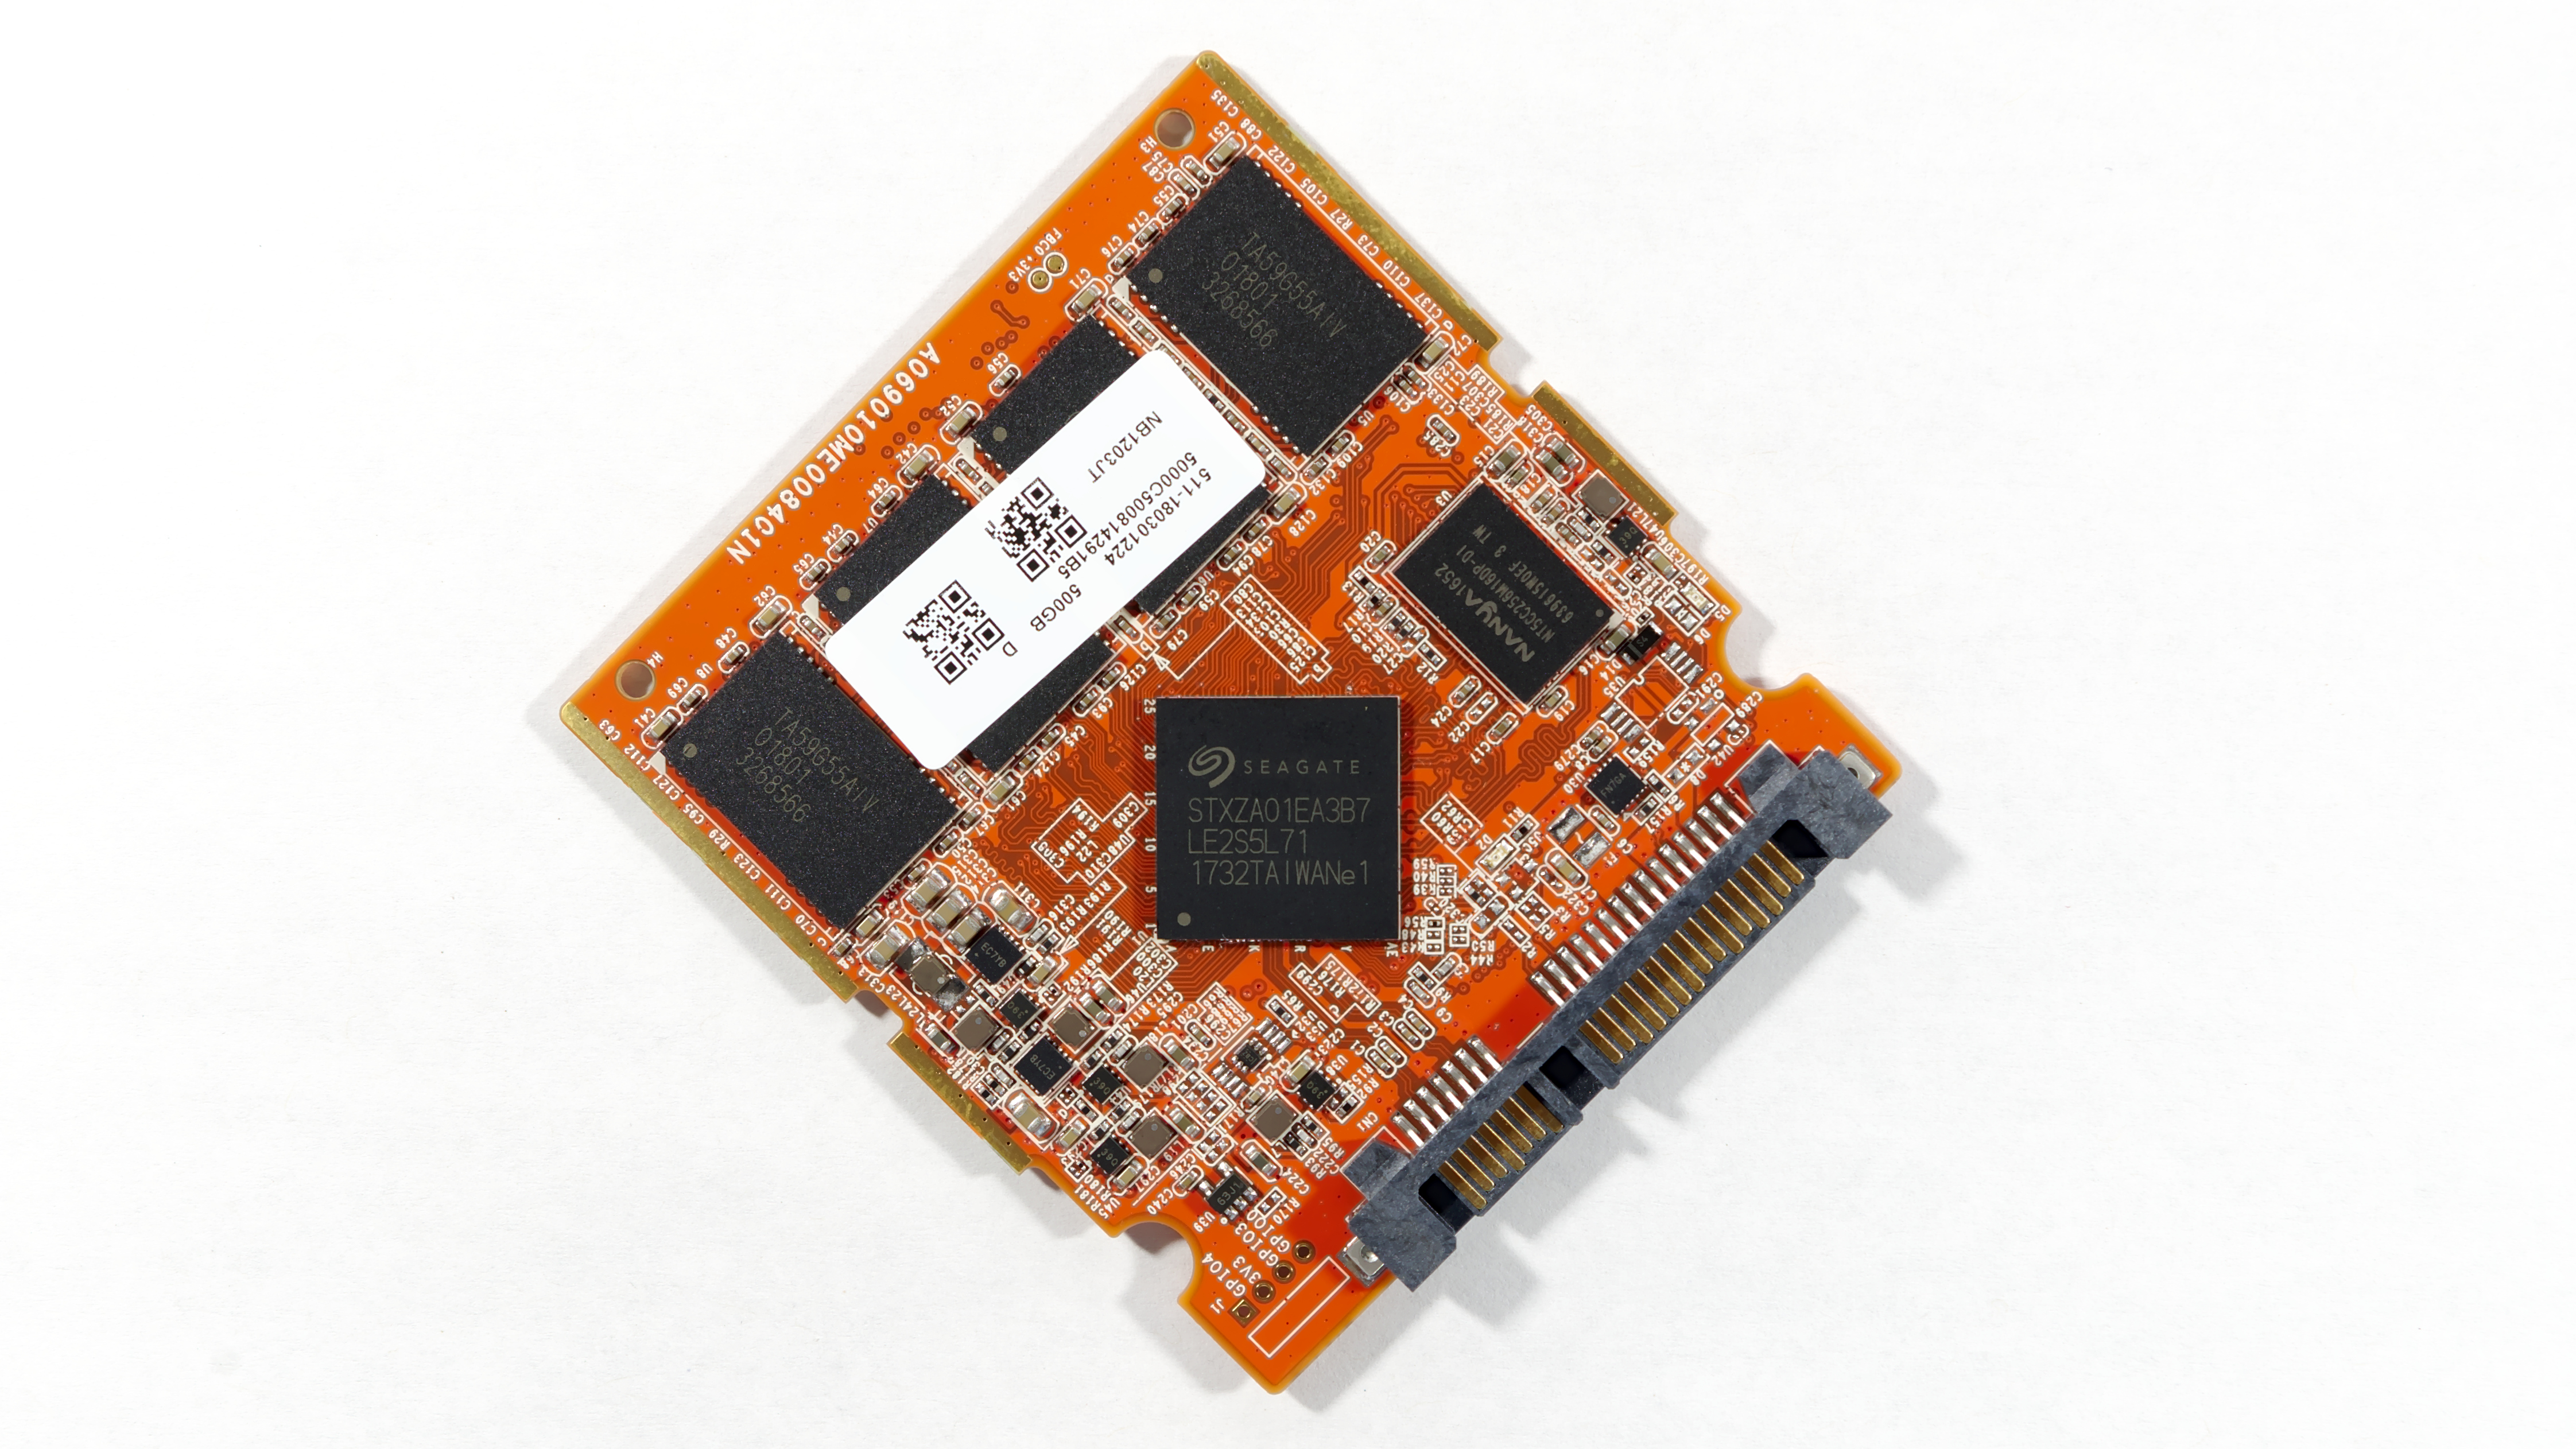


The Seagate BarraCuda actually uses a controller chip bearing Seagate's logo and part number, but we've seen this same basic board layout many times and in many colors. Seagate is hardly the only company that rebrands off the shelf controllers. The Phison S10 is an 8-channel controller so we get 8 NAND packages, with two 256Gb dies in each package. The metal case for the drive is the same that we're used to seeing on Phison S10 drives, but with yet another variation on the paint job.
The main competitors for the Seagate BarraCuda are mainstream SATA drives like the Crucial MX500, Samsung 860 EVO, Intel 545s, and WD Blue/SanDisk Ultra 3D. These all feature 64-layer 3D NAND but more recent SSD controllers. For this review we've also included a pair of current-generation DRAMless SATA SSDs: the Mushkin Source and the Toshiba TR200, the latter of which uses the same NAND as the BarraCuda but Phison's S11 4-channel entry-level SATA SSD controller. We've also thrown in results for some older drives that used the Phison S10 controller with planar NAND: the Toshiba OCZ Trion 150 with 15nm TLC, and the PNY CS2211 with 15nm MLC.
Perhaps the most interesting point of comparison is the Plextor M8V, a drive that's generally hard to find for sale, but is very useful here because it uses the same Toshiba 3D TLC NAND but pairs it with the Silicon Motion SM2258 controller instead of the Phison S10. This helps identify which performance differences are due to the choice of NAND and which are controller or firmware bottlenecks.
| AnandTech 2018 Consumer SSD Testbed | |
| CPU | Intel Xeon E3 1240 v5 |
| Motherboard | ASRock Fatal1ty E3V5 Performance Gaming/OC |
| Chipset | Intel C232 |
| Memory | 4x 8GB G.SKILL Ripjaws DDR4-2400 CL15 |
| Graphics | AMD Radeon HD 5450, 1920x1200@60Hz |
| Software | Windows 10 x64, version 1709 |
| Linux kernel version 4.14, fio version 3.6 | |
| Spectre/Meltdown microcode and OS patches current as of May 2018 | |
- Thanks to Intel for the Xeon E3 1240 v5 CPU
- Thanks to ASRock for the E3V5 Performance Gaming/OC
- Thanks to G.SKILL for the Ripjaws DDR4-2400 RAM
- Thanks to Corsair for the RM750 power supply, Carbide 200R case, and Hydro H60 CPU cooler
- Thanks to Quarch for the XLC Programmable Power Module and accessories
- Thanks to StarTech for providing a RK2236BKF 22U rack cabinet.
Whole-Drive Fill
This test starts with a freshly-erased drive and fills it with 128kB sequential writes at queue depth 32, recording the write speed for each 1GB segment. This test is not representative of any ordinary client/consumer usage pattern, but it does allow us to observe transitions in the drive's behavior as it fills up. This can allow us to estimate the size of any SLC write cache, and get a sense for how much performance remains on the rare occasions where real-world usage keeps writing data after filling the cache.
 |
|||||||||
The SATA bottleneck renders the SLC caching behavior of the Seagate BarraCuda largely irrelevant for sequential writes. Aside from a momentary blip around the 4GB mark, the BarraCuda stays near the limits of the SATA link for the entire drive filling process.
 |
|||||||||
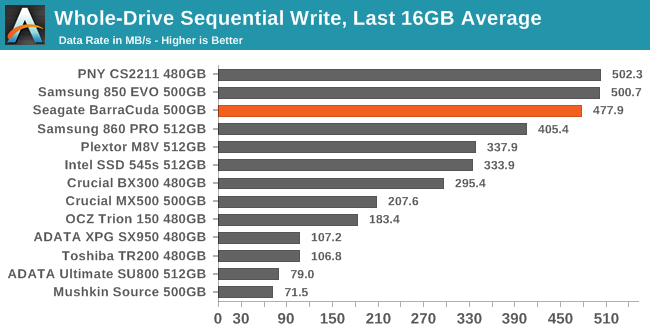
| Average Throughput for last 16 GB | Overall Average Throughput | ||||||||
The Seagate BarraCuda isn't quite able to match the fastest SATA SSDs for sustained write speed, but it is less than 5% slower. Drives with Silicon Motion's 4-channel SATA SSD controllers have shown that there's no real need for 8-channel controllers in the SATA space anymore, but the 8-channel design of the Phison S10 does convey some fringe benefits as seen here.
BAPCo SYSmark 2018
BAPCo's SYSmark 2018 is an application-based benchmark that uses real-world applications to replay usage patterns of business users, with subscores for productivity, creativity and responsiveness. Scores represnt overall system performance and are calibrated against a reference system that is defined to score 1000 in each of the scenarios. A score of, say, 2000, would imply that the system under test is twice as fast as the reference system.
SYSmark scores are based on total application response time as seen by the user, including not only storage latency but time spent by the processor. This means there's a limit to how much a storage improvement could possibly increase scores, because the SSD is only in use for a small fraction of the total test duration. This is a significant difference from our ATSB tests where only the storage portion of the workload is replicated and disk idle times are cut short to a maximum of 25ms.
| AnandTech SYSmark SSD Testbed | |
| CPU | Intel Core i5-7400 |
| Motherboard | ASUS PRIME Z270-A |
| Chipset | Intel Z270 |
| Memory | 2x 8GB Corsair Vengeance DDR4-2400 CL17 |
| Case | In Win C583 |
| Power Supply | Cooler Master G550M |
| OS | Windows 10 64-bit, version 1803 |
Our SSD testing with SYSmark uses a different test system than the rest of our SSD tests. This machine is set up to measure total system power consumption rather than just the drive's power.
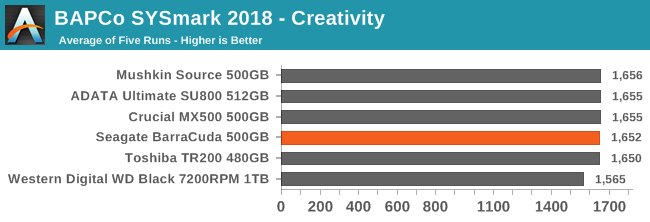
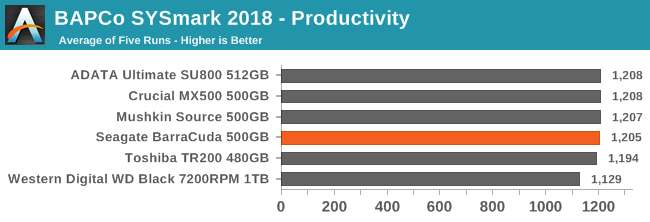
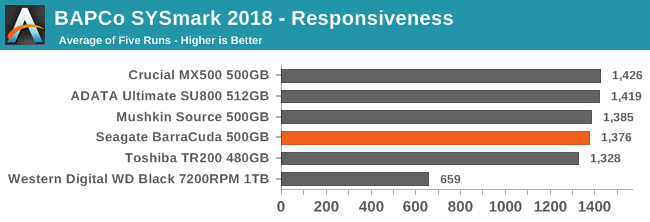
The Seagate BarraCuda provides adequate performance for the CPU and memory-bound Creativity and Productivity scenarios, but on the Responsiveness test it comes up a bit short of what a mainstream SATA SSD should deliver. Instead, it scores more in line with the DRAMless SATA SSDs, which is still far better than a 7200RPM hard drive.
Energy Usage
The SYSmark energy usage scores measure total system power consumption, excluding the display. Our SYSmark test system idles at around 26 W and peaks at over 60 W measured at the wall during the benchmark run. SATA SSDs seldom exceed 5 W and idle at a fraction of a watt, and the SSDs spend most of the test idle. This means the energy usage scores will inevitably be very close. A typical notebook system will tend to be better optimized for power efficiency than this desktop system, so the SSD would account for a much larger portion of the total and the score difference between SSDs would be more noticeable.
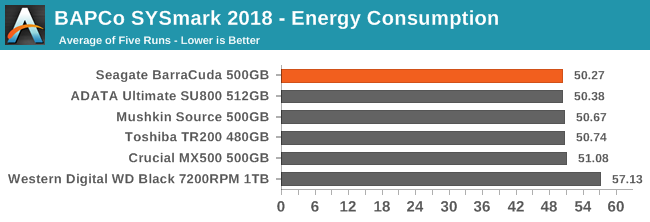
The overall system energy usage during SYSmark is reasonably low for the Seagate BarraCuda, indicating that the slightly lower performance of the BarraCuda doesn't add much to the overall runtime of the test. The good active idle power management (see page 9) also contributes to this good score.
AnandTech Storage Bench - The Destroyer
The Destroyer is an extremely long test replicating the access patterns of very IO-intensive desktop usage. A detailed breakdown can be found in this article. Like real-world usage, the drives do get the occasional break that allows for some background garbage collection and flushing caches, but those idle times are limited to 25ms so that it doesn't take all week to run the test. These AnandTech Storage Bench (ATSB) tests do not involve running the actual applications that generated the workloads, so the scores are relatively insensitive to changes in CPU performance and RAM from our new testbed, but the jump to a newer version of Windows and the newer storage drivers can have an impact.
We quantify performance on this test by reporting the drive's average data throughput, the average latency of the I/O operations, and the total energy used by the drive over the course of the test.
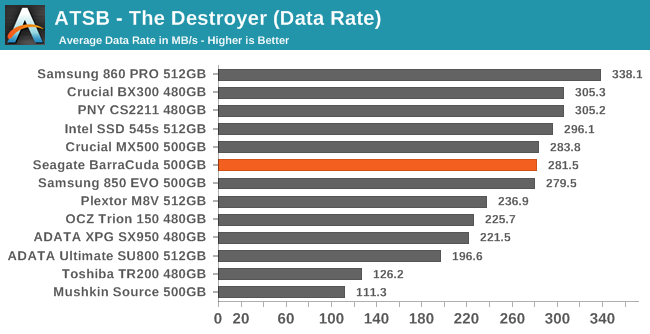
The Seagate BarraCuda SSD is broadly competitive with other TLC SATA drives on The Destroyer, with an average data rate that is clearly slower than the best an MLC drive can deliver but is almost identical to the mainstream Crucial MX500, and significantly higher than the Plextor M8V that pairs Toshiba's 3D TLC with a different controller.
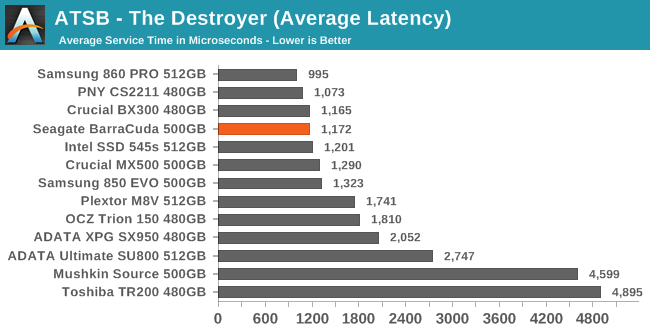
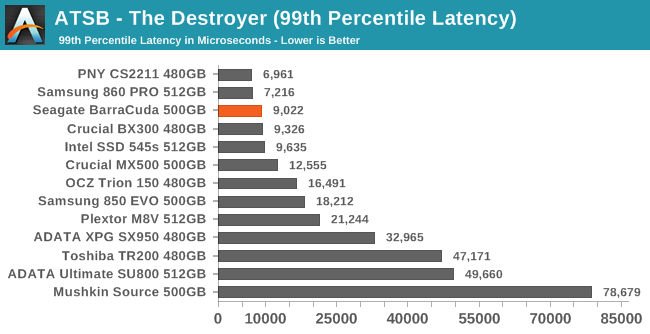
The average and 99th percentile latencies from the Seagate BarraCuda are lower than any of the competing TLC SSDs, and reasonably close to the best we've measured from SATA drives in this capacity class.
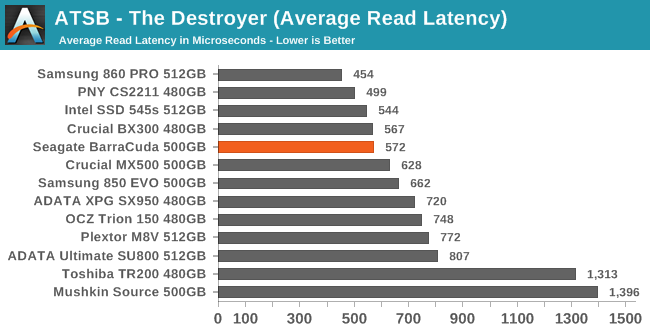
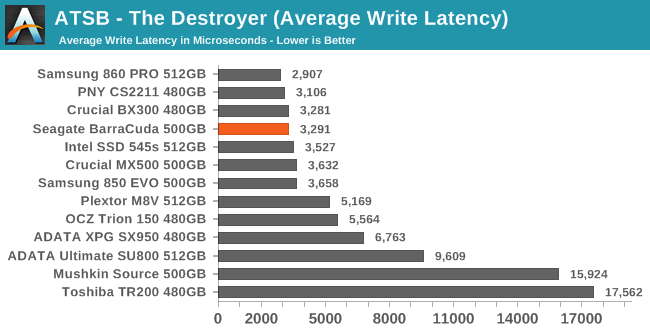
The average read and write latencies from the BarraCuda are both among the best we've seen from TLC SATA SSDs, though other current-generation mainstream drives like the Crucial MX500 and Intel 545s aren't significantly behind. The average write latencies in particular vary little among top-tier SATA drives (MLC or TLC).
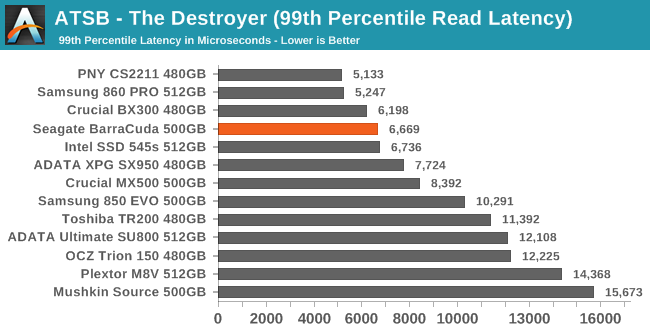
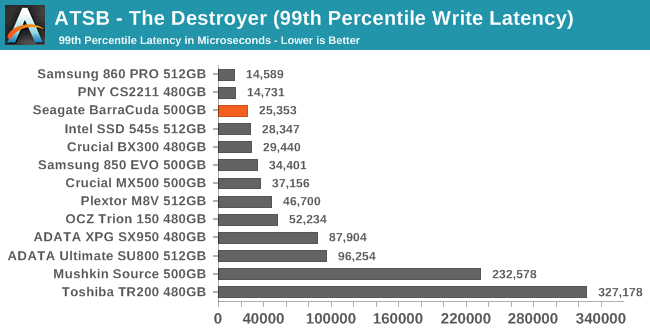
The 99th percentile read and write latencies show more variation between SATA drives than the averages, and here the Seagate BarraCuda continues to distinguish itself by taking the lead among TLC SATA drives, followed closely by the Intel 545s.
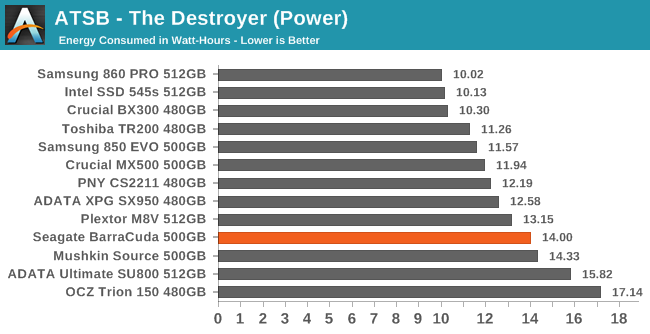
The Seagate BarraCuda's solid performance on The Destroyer comes at the cost of rather high energy usage, almost 40% higher than the Intel 545s that is slightly faster overall. The aging Phison S10 controller is probably the main culprit here, but the Plextor M8V with the same NAND but a Silicon Motion controller is also relatively inefficient on this test.
AnandTech Storage Bench - Heavy
Our Heavy storage benchmark is proportionally more write-heavy than The Destroyer, but much shorter overall. The total writes in the Heavy test aren't enough to fill the drive, so performance never drops down to steady state. This test is far more representative of a power user's day to day usage, and is heavily influenced by the drive's peak performance. The Heavy workload test details can be found here. This test is run twice, once on a freshly erased drive and once after filling the drive with sequential writes.
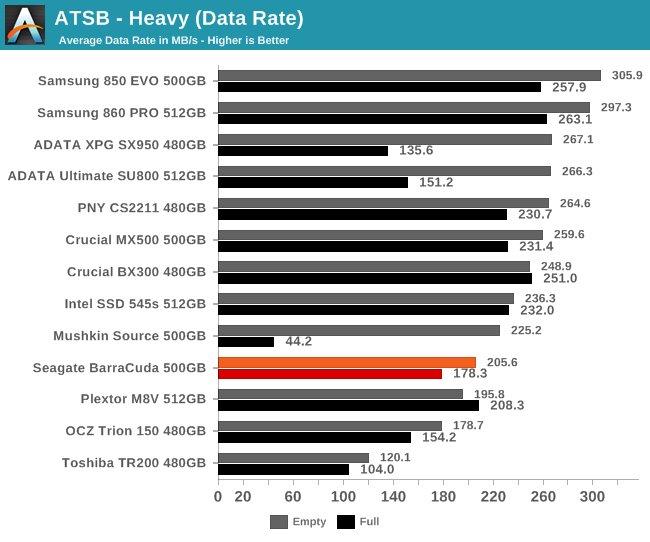
The Seagate BarraCuda's average data rate on the Heavy test is lower than normal for mainstream TLC SATA drives. The Plextor M8V performs similarly, suggesting that the Toshiba 3D TLC NAND is a more important contributor to this poor performance than the aging Phison S10 controller that the BarraCuda uses. Overall performance from the BarraCuda doesn't suffer much when the test is run on a full drive, but that's also generally true of current-generation mainstream drives.
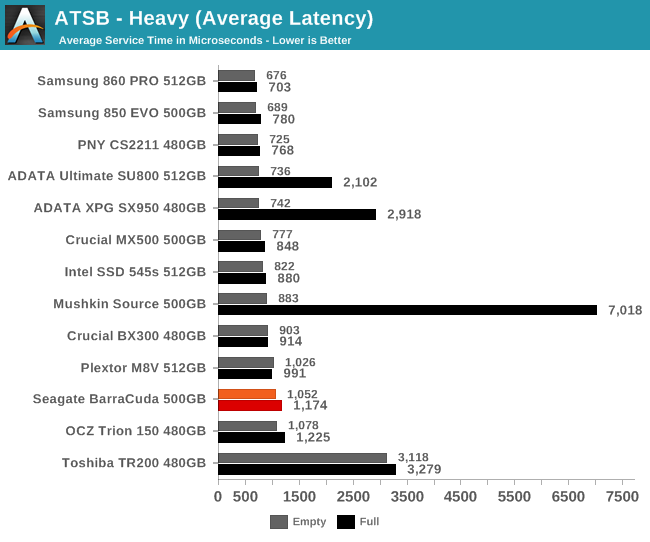
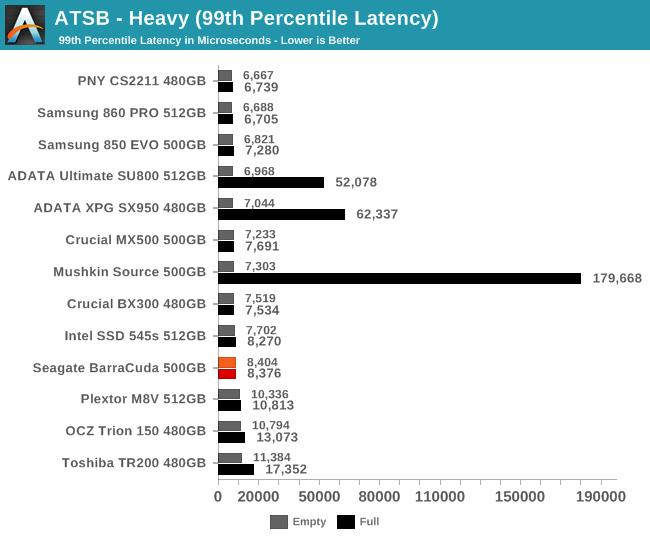
The average and 99th percentile latency scores from the BarraCuda are a bit on the high side, but the gap between the BarraCuda and the fastest SATA drives is less than a factor of two. More importantly, the BarraCuda is not a severe outlier even for the full-drive test run, and it does not appear that the BarraCuda suffers from any severe stuttering even under intense workloads.
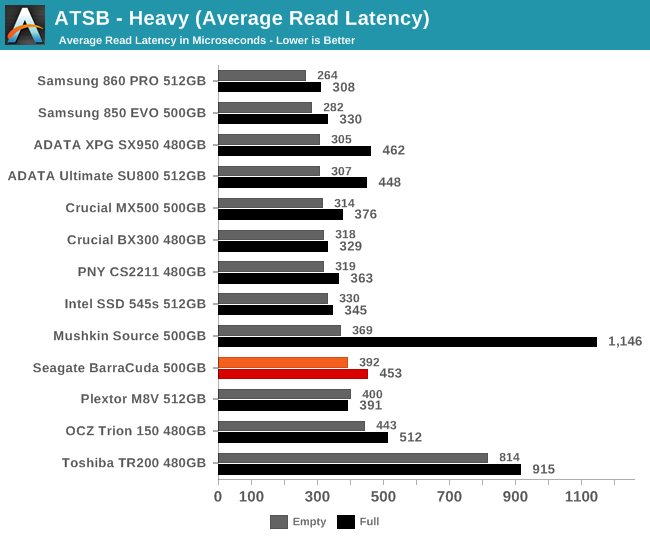
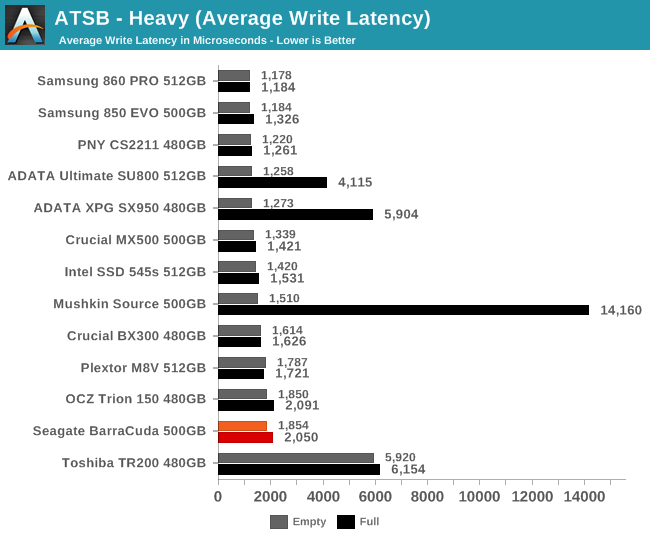
The average read and write latencies for the BarraCuda aren't vastly slower than other mainstream drives, but the BarraCuda does rank near last place among its primary competitors, with write latency being a bit more of a problem than read latency.
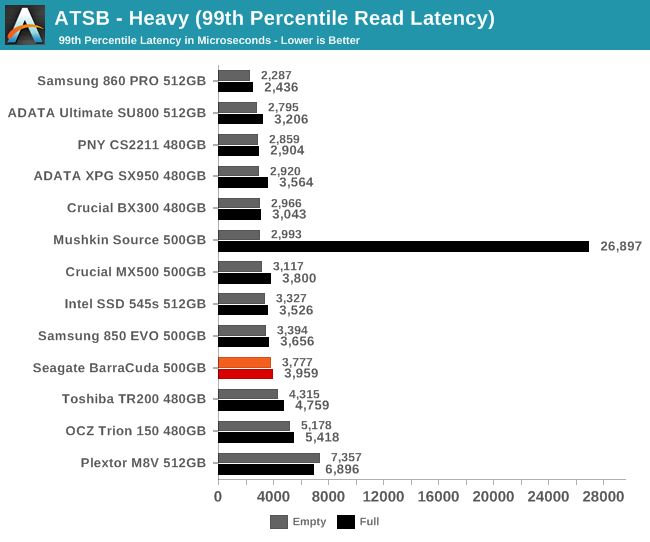
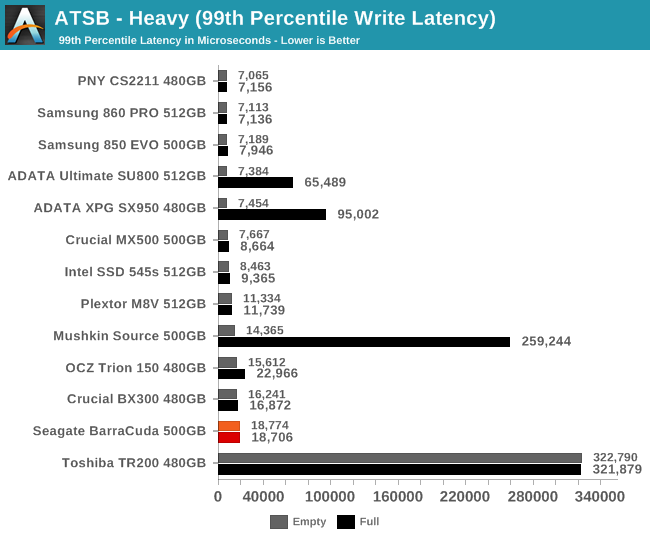
The 99th percentile read latency from the BarraCuda is only slightly worse than other mainstream TLC drives, and fortunately much better than the Plextor M8V's score. The BarraCuda's 99th percentile write latency is worse off, with more than twice the latency of its primary competition.
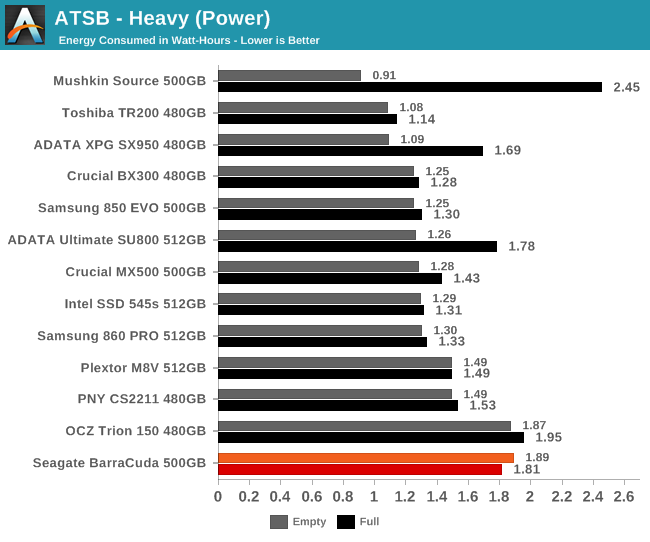
The Seagate BarraCuda is more or less tied with the planar TLC-based OCZ Trion 150 for worse overall energy efficiency on the Heavy test, though the DRAMless Mushkin Source is so slow on the full-drive test run that its energy usage outstrips everything else.
AnandTech Storage Bench - Light
Our Light storage test has relatively more sequential accesses and lower queue depths than The Destroyer or the Heavy test, and it's by far the shortest test overall. It's based largely on applications that aren't highly dependent on storage performance, so this is a test more of application launch times and file load times. This test can be seen as the sum of all the little delays in daily usage, but with the idle times trimmed to 25ms it takes less than half an hour to run. Details of the Light test can be found here. As with the ATSB Heavy test, this test is run with the drive both freshly erased and empty, and after filling the drive with sequential writes.
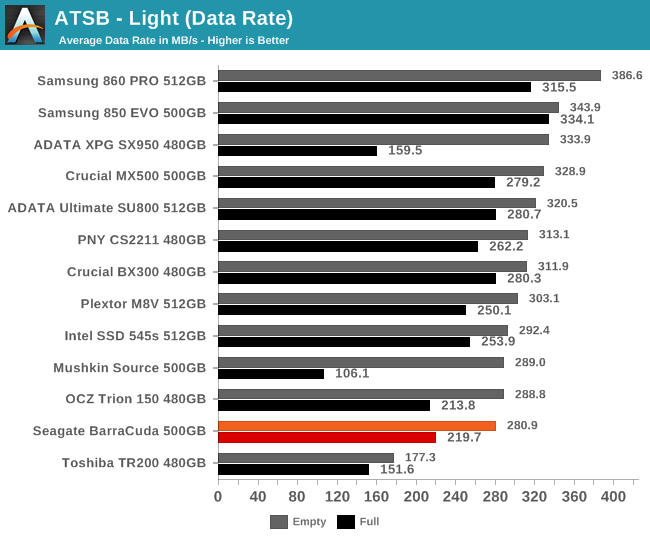
The Seagate Barracuda's average data rate on the Light test is the slowest among mainstream SATA drives, at about 15-20% slower overall than the best SATA drives with TLC NAND.
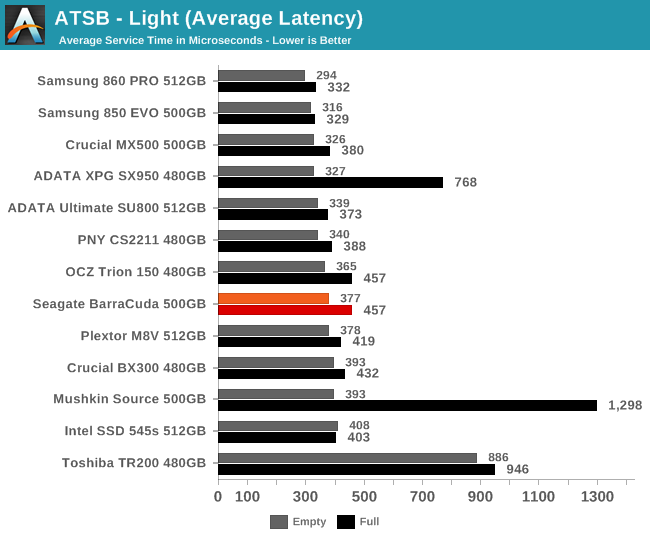
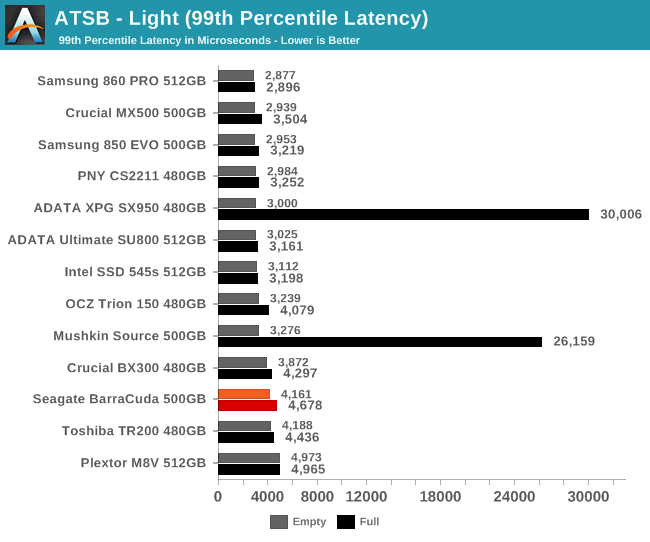
The average latency from the BarraCuda during the Light test is higher than some of the best mainstream drives like the Crucial MX500, but not high enough to be a concern. The 99th percentile latency scores are worse by than most of the competition by at least 1ms, which suggests that the BarraCuda might have some very mild stuttering, but nothing like what the Mushkin Source or ADATA SX950 exhibit when full.
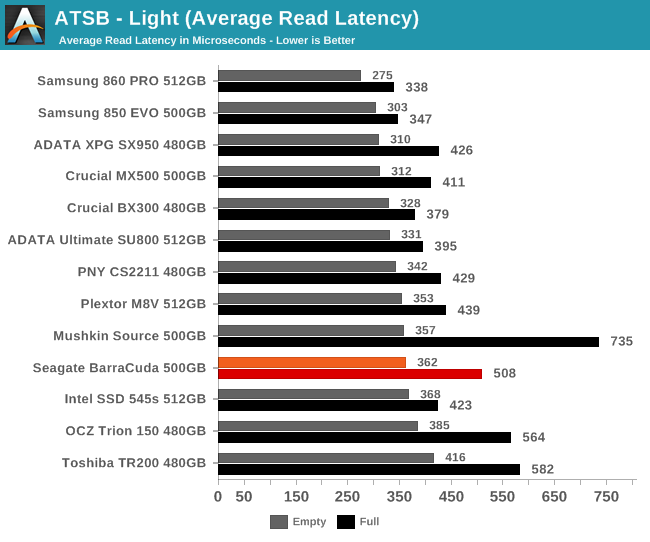
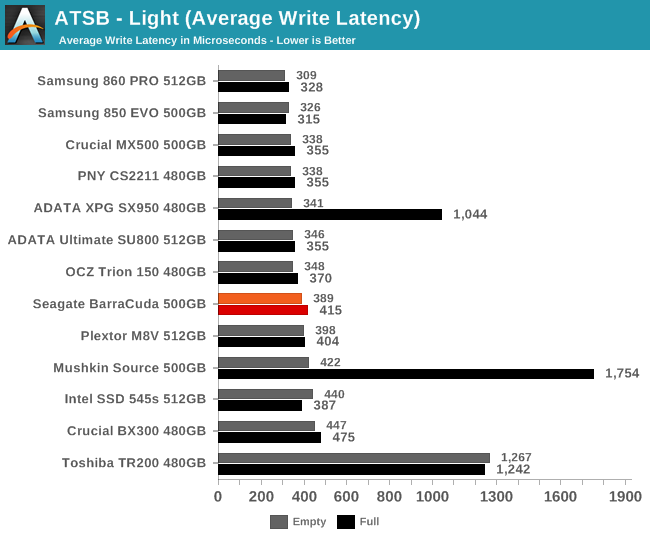
The average read and write latencies from the BarraCuda aren't top notch but still mostly fall within the normal range for mainstream SATA drives. The read latency takes a fairly large hit when the test is run on a full drive, leaving it slower than any recent mainstream drive, but still faster than the two DRAMless SSDs.
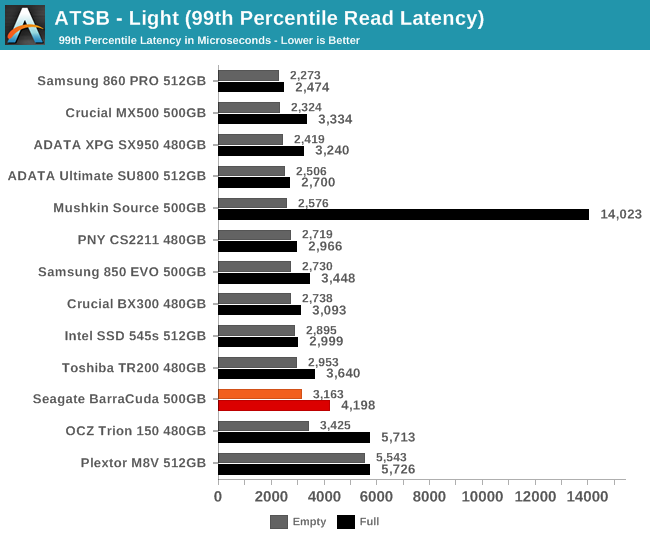
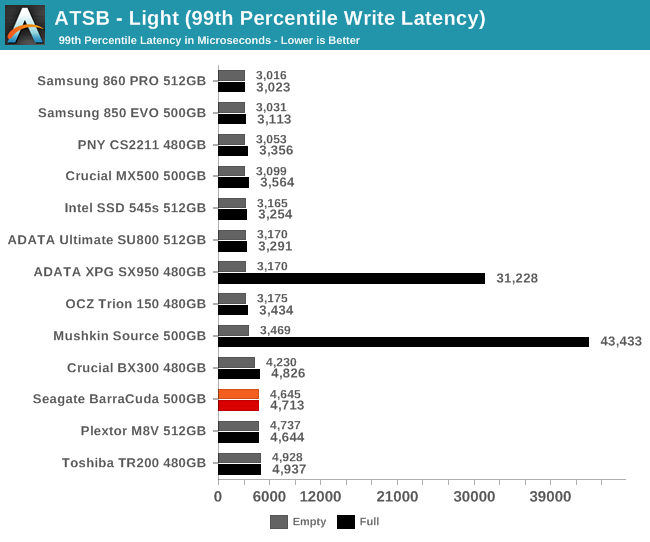
The 99th percentile read and write latency scores for the BarraCuda both show that the BarraCuda is slightly slower than its competition, but not by enough to be a serious problem.
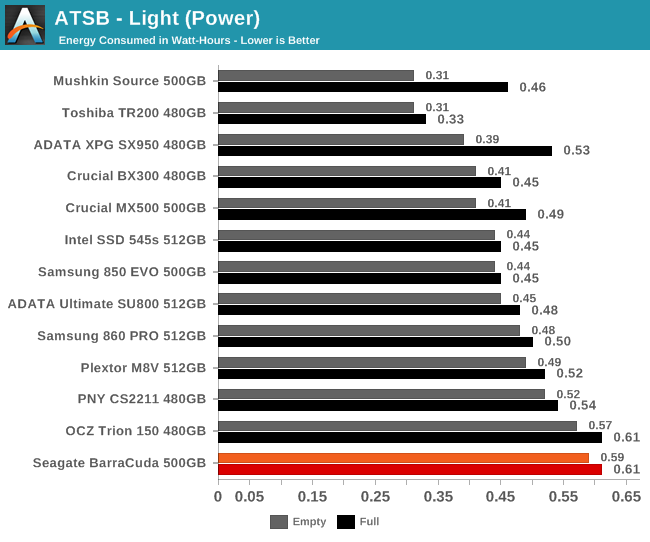
The Seagate BarraCuda is the least energy-efficient drive in this bunch, due in part to its low performance, but high power consumption under load is the bigger factor on this test.
Random Read Performance
Our first test of random read performance uses very short bursts of operations issued one at a time with no queuing. The drives are given enough idle time between bursts to yield an overall duty cycle of 20%, so thermal throttling is impossible. Each burst consists of a total of 32MB of 4kB random reads, from a 16GB span of the disk. The total data read is 1GB.
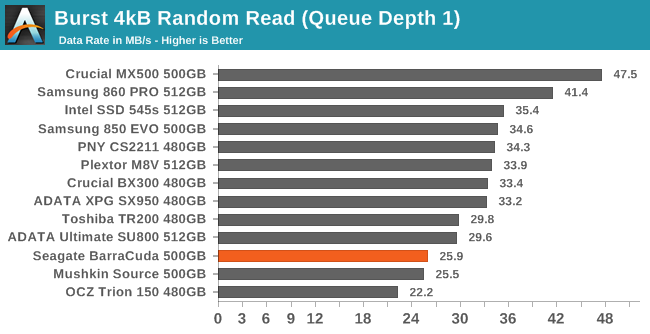
The burst random read speed of the Seagate BarraCuda is rather slow, both in comparison to the broad field of competing SSDs, and in comparison to the other drives that use Toshiba's 3D TLC: the Plextor M8V is 30% faster, and even the DRAMless Toshiba TR200 is 15% faster.
Our sustained random read performance is similar to the random read test from our 2015 test suite: queue depths from 1 to 32 are tested, and the average performance and power efficiency across QD1, QD2 and QD4 are reported as the primary scores. Each queue depth is tested for one minute or 32GB of data transferred, whichever is shorter. After each queue depth is tested, the drive is given up to one minute to cool off so that the higher queue depths are unlikely to be affected by accumulated heat build-up. The individual read operations are again 4kB, and cover a 64GB span of the drive.
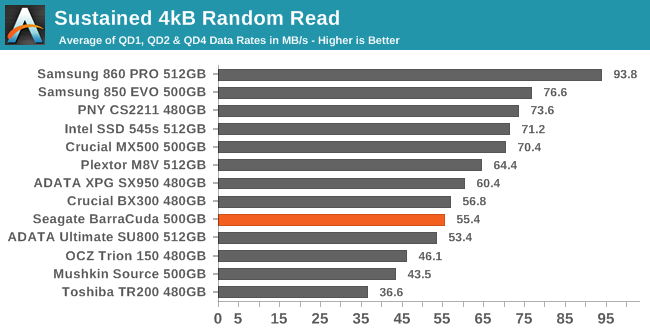
On the longer random read test, the BarraCuda appropriately pulls ahead of the Toshiba TR200 but remains much slower than the other current-generation mainstream competitors.
 |
|||||||||
| Power Efficiency in MB/s/W | Average Power in W | ||||||||
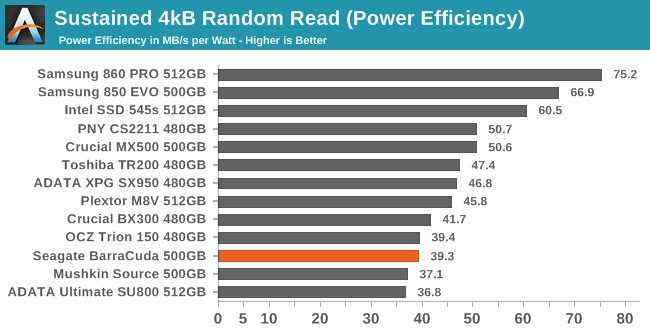
The BarraCuda is among the most power-hungry drives on this test, leaving it with a very poor power efficiency rating. The best TLC SATA drives offer 50% better performance per Watt, and the Plextor M8V gets 16% better performance while drawing the same amount of power.
 |
|||||||||
As queue depths increase, the BarraCuda stays a little bit slower than most mainstream TLC SSDs, and past QD16 it starts to level out with significantly slower random read performance than the competition. On the bright side, power consumption doesn't increase very quickly as queue depth grows, so the efficiency at high queue depths is no longer such a negative outlier.
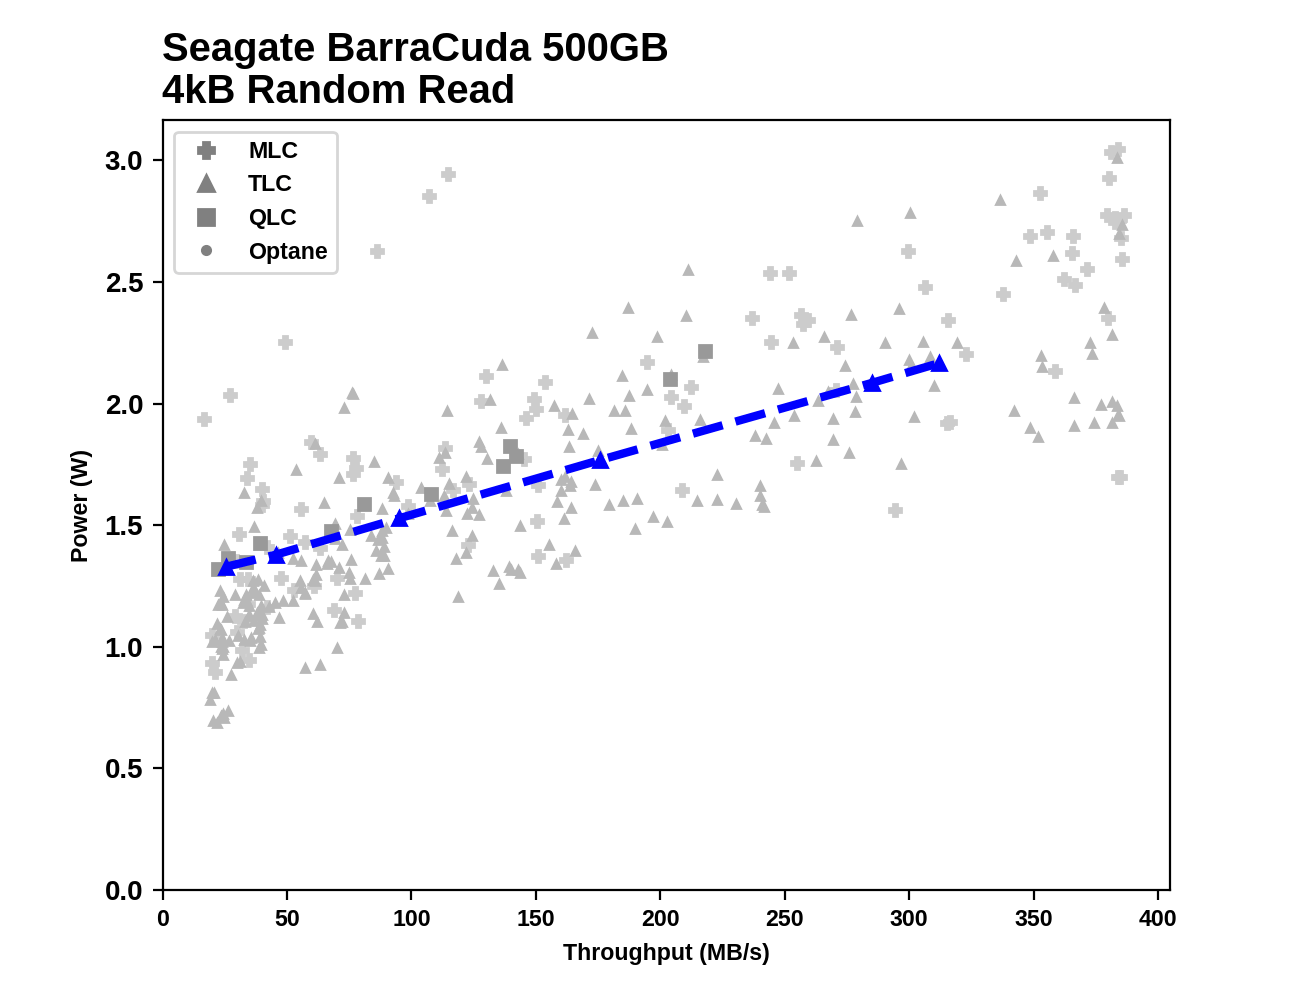
Comparing the Seagate BarraCuda against our entire collection of SATA SSDs new and old, it's clear that the power efficiency could use some improvement but it's by no means the worst we've tested.
Random Write Performance
Our test of random write burst performance is structured similarly to the random read burst test, but each burst is only 4MB and the total test length is 128MB. The 4kB random write operations are distributed over a 16GB span of the drive, and the operations are issued one at a time with no queuing.
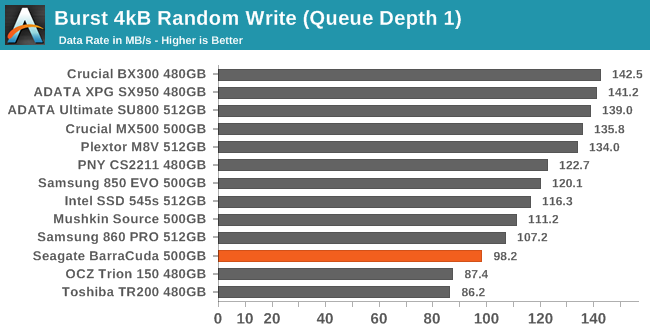
The Seagate BarraCuda disappoints on the burst random write test with QD1 performance that is well below that of many current and previous generation SSDs, including some DRAMless drives. The Plextor M8V is 36% faster on this test due to pairing the same Toshiba NAND with a more recent Silicon Motion controller rather than the Phison S10.
As with the sustained random read test, our sustained 4kB random write test runs for up to one minute or 32GB per queue depth, covering a 64GB span of the drive and giving the drive up to 1 minute of idle time between queue depths to allow for write caches to be flushed and for the drive to cool down.
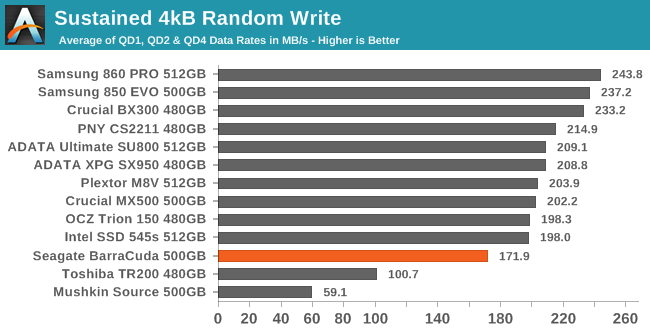
On the longer random write test that involves some higher queue depths, the differences between mainstream SATA drives are smaller than at QD1 but the BarraCuda is still clearly below par. However, it is at least far faster than the DRAMless drives.
 |
|||||||||
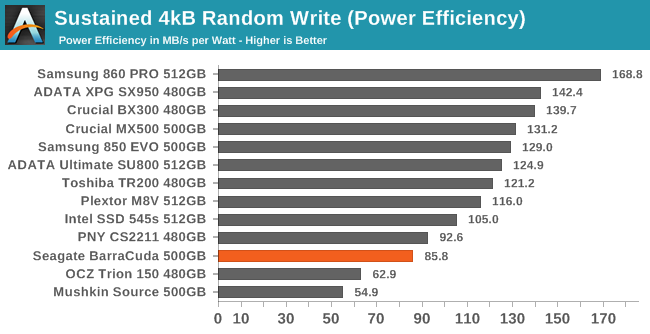
| Power Efficiency in MB/s/W | Average Power in W | ||||||||
Power consumption for the BarraCuda on this test is a bit high, so the efficiency score is again fairly low. Other current mainstream SATA SSDs offer at least 20% better performance per Watt. The Plextor M8V is 18% faster while drawing 12% less power, and that still isn't close to the best efficiency we're seeing from non-Toshiba 3D TLC.
 |
|||||||||
Random write performance saturating at QD4 and higher is normal for SATA drives, but the performance level that the BarraCuda tops out at is well below what we expect from mainstream SSDs these days. The Plextor M8V delivers more performance at lower power levels across all queue depths, while using a 4-channel Silicon Motion controller instead of the 8-channel Phison S10 to manage the same Toshiba 3D TLC.
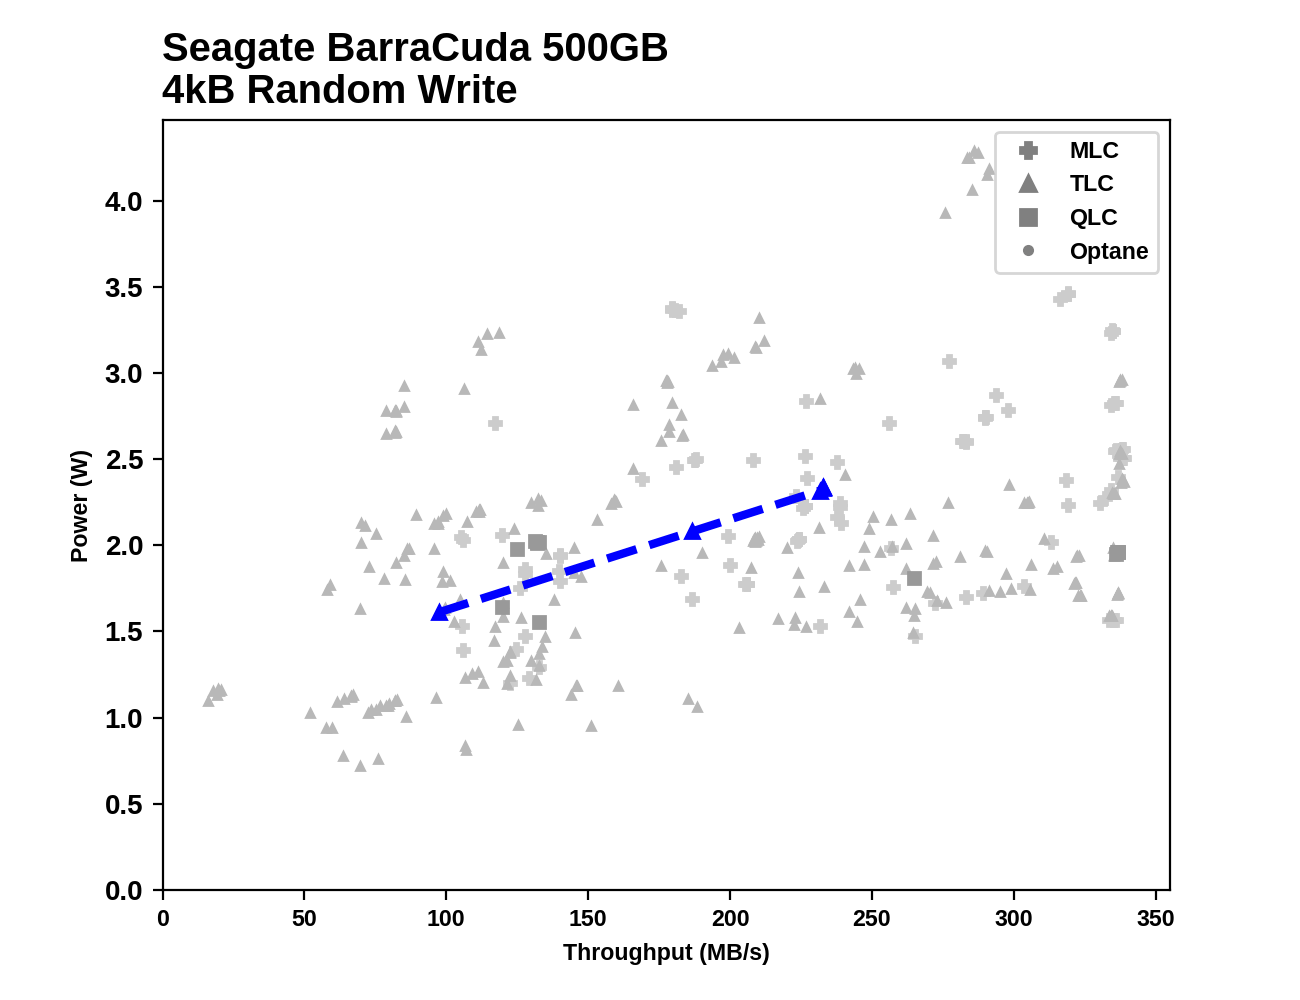
Comparing the Seagate BarraCuda against every SATA SSD that has completed this test, we again see that power consumption is substantially higher than the best drives out there, and the maximum random write performance attained falls far short of the best that a SATA drive can deliver.
Sequential Read Performance
Our first test of sequential read performance uses short bursts of 128MB, issued as 128kB operations with no queuing. The test averages performance across eight bursts for a total of 1GB of data transferred from a drive containing 16GB of data. Between each burst the drive is given enough idle time to keep the overall duty cycle at 20%.
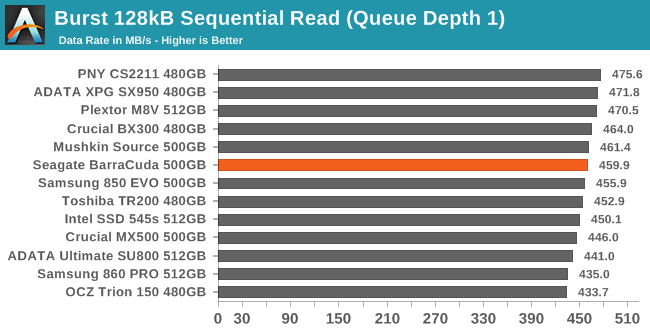
The Seagate BarraCuda has no trouble keeping pace with the competition during the burst sequential read test, with slightly above average performance among a tightly-packed field.
Our test of sustained sequential reads uses queue depths from 1 to 32, with the performance and power scores computed as the average of QD1, QD2 and QD4. Each queue depth is tested for up to one minute or 32GB transferred, from a drive containing 64GB of data. This test is run twice: once with the drive prepared by sequentially writing the test data, and again after the random write test has mixed things up, causing fragmentation inside the SSD that isn't visible to the OS. These two scores represent the two extremes of how the drive would perform under real-world usage, where wear leveling and modifications to some existing data will create some internal fragmentation that degrades performance, but usually not to the extent shown here.
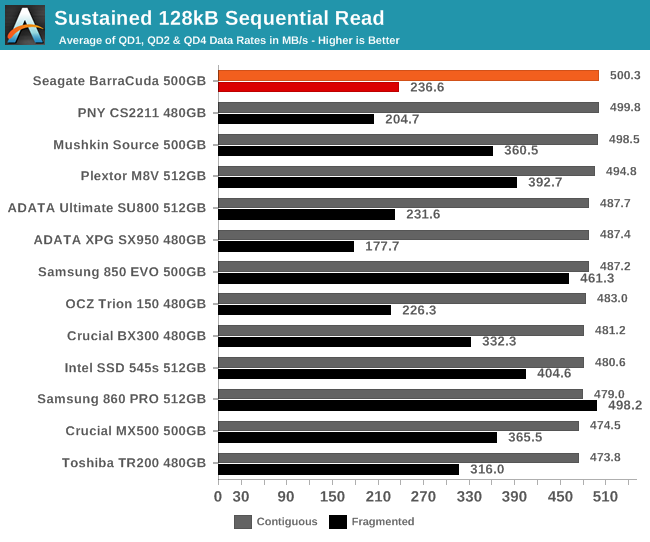
On the longer sequential read test that brings in some higher queue depths, the Seagate BarraCuda provides excellent performance reading data that was originally written sequentially but is one of the slower drives at reassembling data that was written randomly and is not contiguous on the flash itself. The Plextor M8V is 52% faster handling reads of fragmented data.
 |
|||||||||
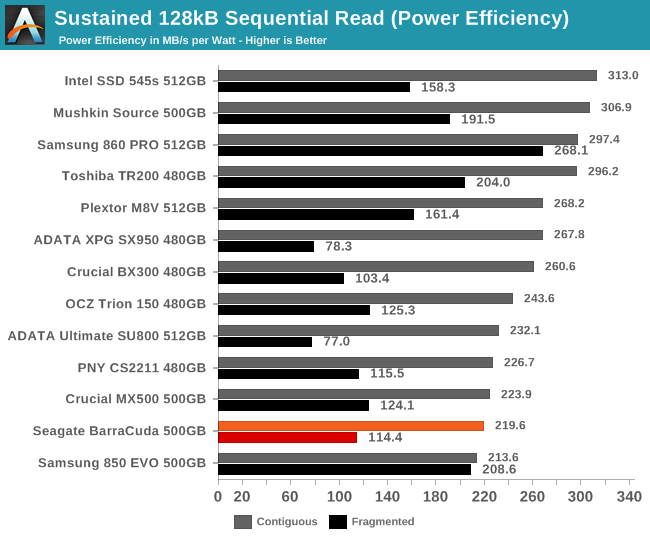
| Power Efficiency in MB/s/W | Average Power in W | ||||||||
The BarraCuda's power efficiency scores for sequential reads are poor despite the high best-case performance, because the drive's power consumption is also among the highest. The power consumption doesn't increase during the more difficult task of reading internally-fragmented data, so the efficiency in that case is not remarkably low compared to most of the competition.
 |
|||||||||
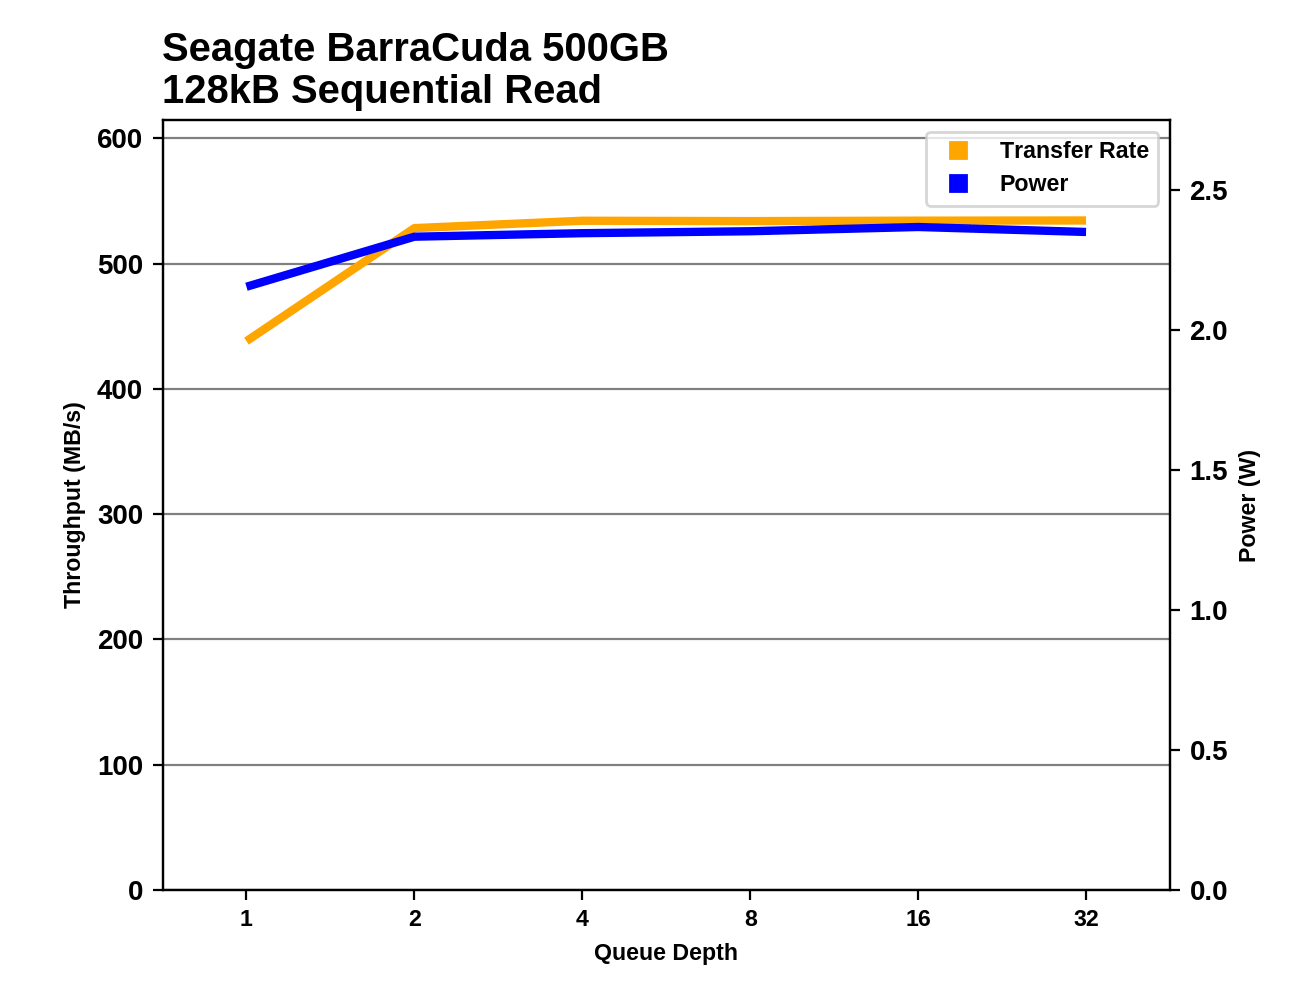
The Seagate BarraCuda maintains a steady high sequential read performance throughout the test as queue depths increase, but it also draws more power than most drives the whole time.
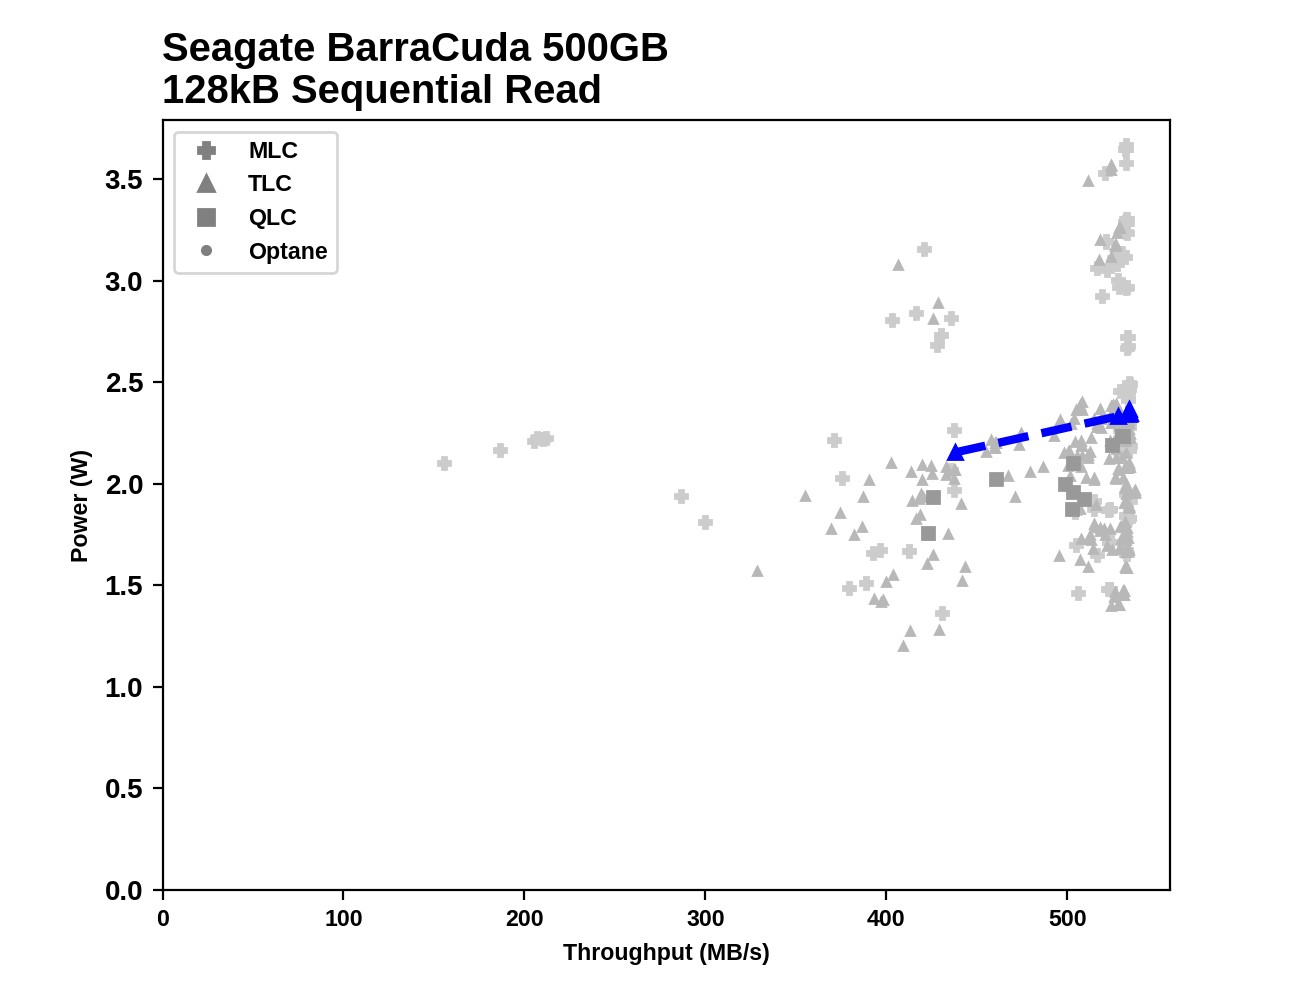
Comparing the BarraCuda against our entire collection of SATA SSDs shows that there's no real room for performance improvement on sequential reads for SATA drives, but there is room for the BarraCuda to cut power consumption by almost half without breaking any records.
Sequential Write Performance
Our test of sequential write burst performance is structured identically to the sequential read burst performance test save for the direction of the data transfer. Each burst writes 128MB as 128kB operations issued at QD1, for a total of 1GB of data written to a drive containing 16GB of data.
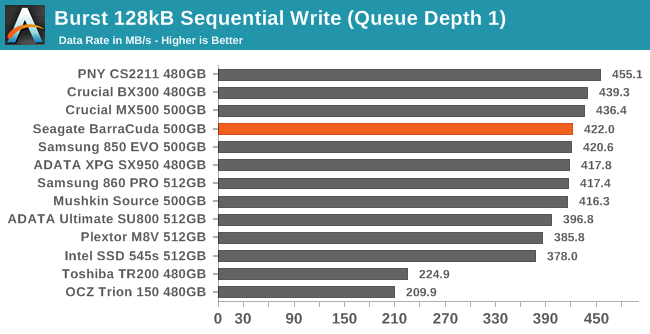
The Seagate BarraCuda doesn't quite deliver the best QD1 sequential write performance possible from a SATA drive, but it is close and tied with many other mainstream drives.
Our test of sustained sequential writes is structured identically to our sustained sequential read test, save for the direction of the data transfers. Queue depths range from 1 to 32 and each queue depth is tested for up to one minute or 32GB, followed by up to one minute of idle time for the drive to cool off and perform garbage collection. The test is confined to a 64GB span of the drive.
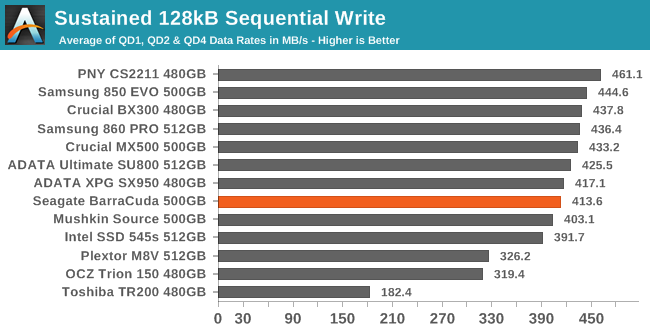
On the longer sequential write test, the BarraCuda is just a bit slower than average but isn't the slowest current-generation mainstream drive. As with the burst sequential write test, the Plextor M8V is significantly slower; this is one of the few areas where the SM2258 controller gets worse performance from the Toshiba 3D TLC than the Phison S10 used by the Seagate BarraCuda.
 |
|||||||||
| Power Efficiency in MB/s/W | Average Power in W | ||||||||
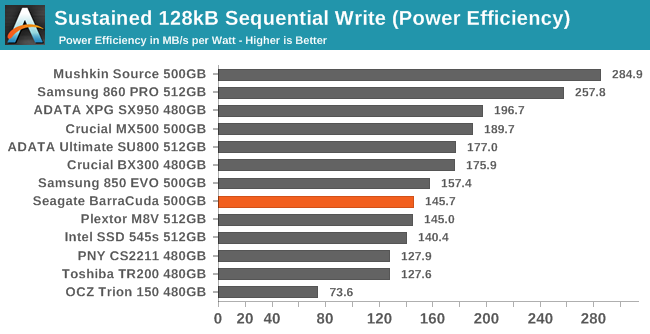
The power consumption of the BarraCuda during the sequential write test is higher than any of the other drives save for the older Phison S10 drives, but the efficiency doesn't stand out as being much worse than several other mainstream TLC drives. The top efficiency scores go to a DRAMless TLC drive, followed by a pair of niche MLC drives. The Plextor M8V's efficiency is almost identical to that of the BarraCuda despite the significant controller difference between the two drives.
 |
|||||||||
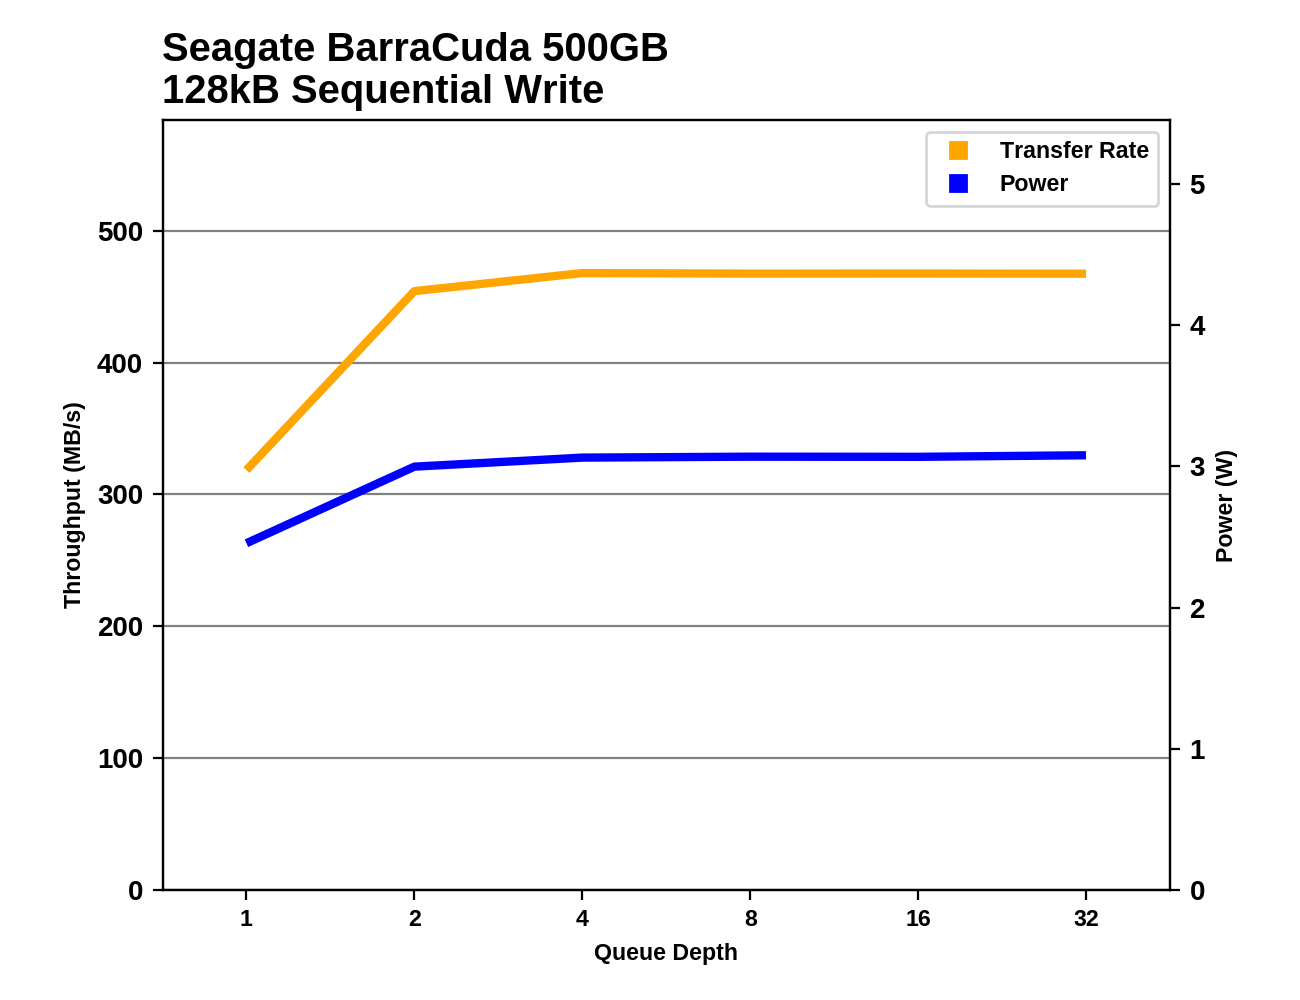
At QD2 the Seagate BarraCuda hasn't quite reached its full sequential write speed. At QD4 and higher it is steady but about 30MB/s slower than the fastest TLC drives. The other drives using the same Toshiba 3D TLC are much slower: the Plextor M8V with a 4-channel SMI controller, and the Toshiba TR200 with a DRAMliess Phison S11 controller.
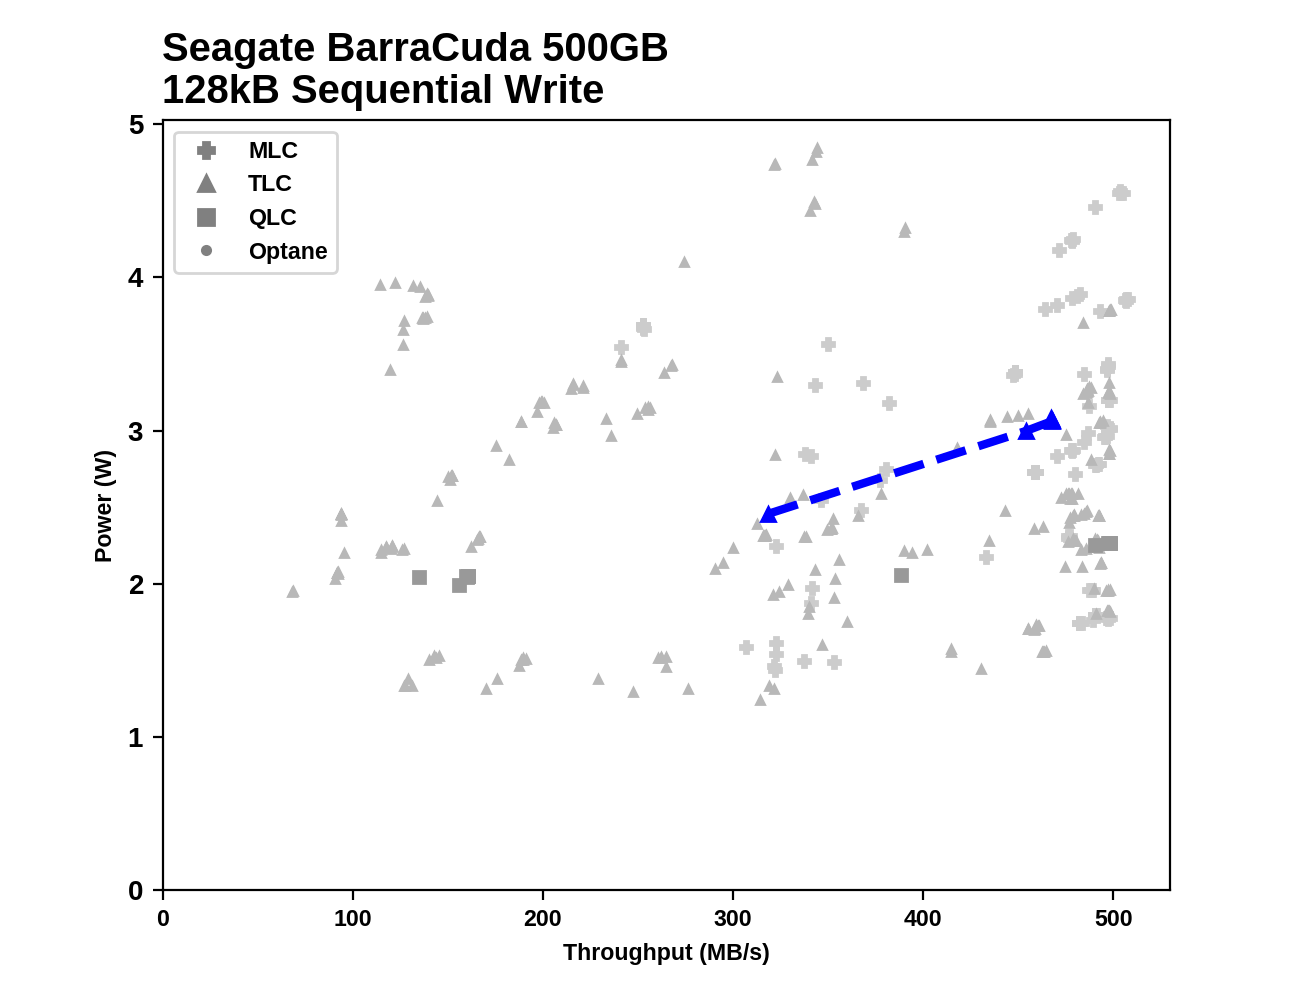
The peak sequential write speed for the BarraCuda is slightly below the SATA limit but still falls within the normal range of variation for SATA drives. Power consumption would have to drop by more than 1W in order to get the BarraCuda near the top of the efficiency rankings for TLC SATA drives.
Mixed Random Performance
Our test of mixed random reads and writes covers mixes varying from pure reads to pure writes at 10% increments. Each mix is tested for up to 1 minute or 32GB of data transferred. The test is conducted with a queue depth of 4, and is limited to a 64GB span of the drive. In between each mix, the drive is given idle time of up to one minute so that the overall duty cycle is 50%.
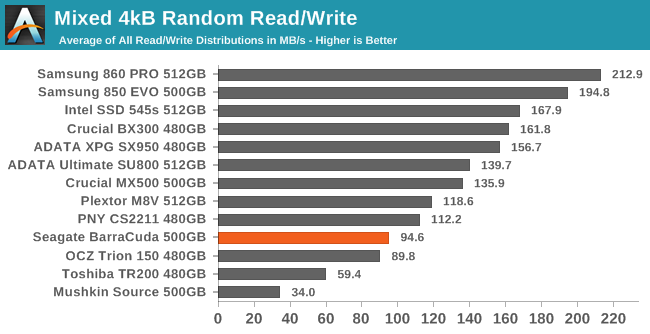
The Seagate BarraCuda fares poorly on the mixed random I/O test, as do the other Phison S10 drives, even the PNY CS2211 with MLC NAND. The Plextor M8V is the next slowest drive with a mainstream controller, so it appears that the poor performance here from the Seagate BarraCuda is at least partly due to the NAND and is not just due to the Phison S10 controller.
 |
|||||||||
| Power Efficiency in MB/s/W | Average Power in W | ||||||||
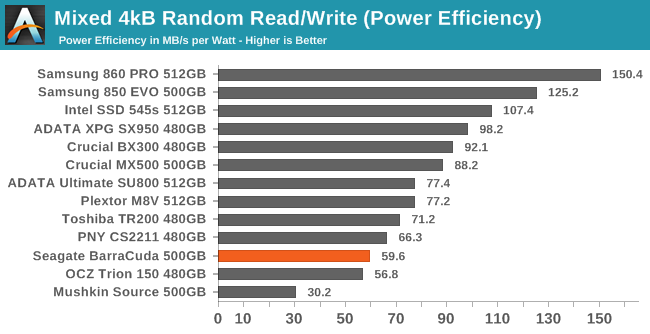
Most mainstream SATA drives in this capacity class average around 1.5-1.6W during this test, so the efficiency rankings largely mirror the performance rankings. That leaves the BarraCuda again near the bottom of the chart.
 |
|||||||||
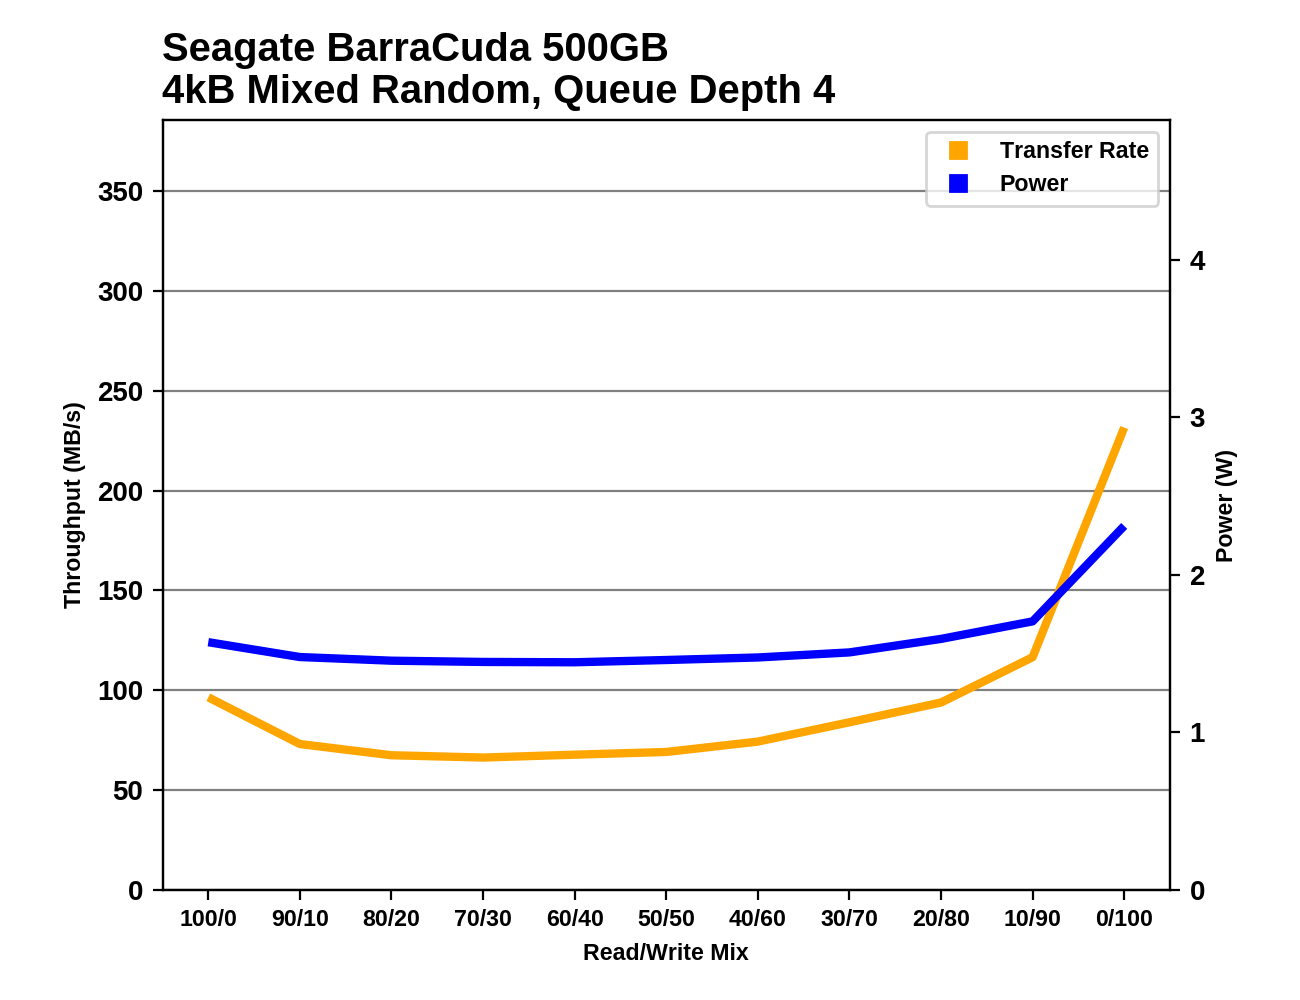
The fastest drives on this test are the ones that avoid performance drops when writes are added to the mix and instead steadily gain performance as the test progresses. The Seagate BarraCuda doesn't pull that off, with performance that drops when writes are first added to the mix and doesn't recover until near the end of the test when the workload is almost entirely writes.
Mixed Sequential Performance
Our test of mixed sequential reads and writes differs from the mixed random I/O test by performing 128kB sequential accesses rather than 4kB accesses at random locations, and the sequential test is conducted at queue depth 1. The range of mixes tested is the same, and the timing and limits on data transfers are also the same as above.
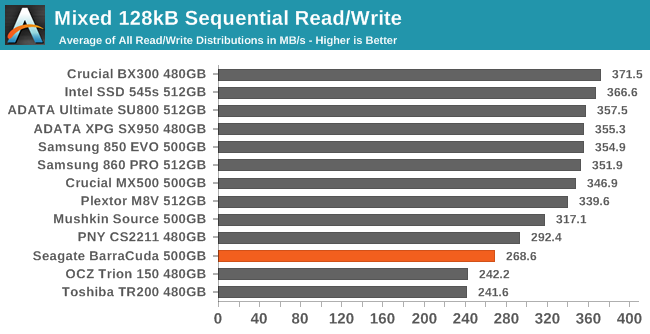
The Seagate BarraCuda had great sequential read performance and competitive sequential write performance, but it doesn't handle mixed sequential workloads all that well. As with the mixed random I/O test, the Phison S10 drives are all clustered at the bottom of the chart along with the DRAMless SSDs, while the other mainstream TLC SSDs offer at least 26% higher overall performance—and that comes from the Plextor M8V that uses the same Toshiba 3D TLC as the BarraCuda.
 |
|||||||||
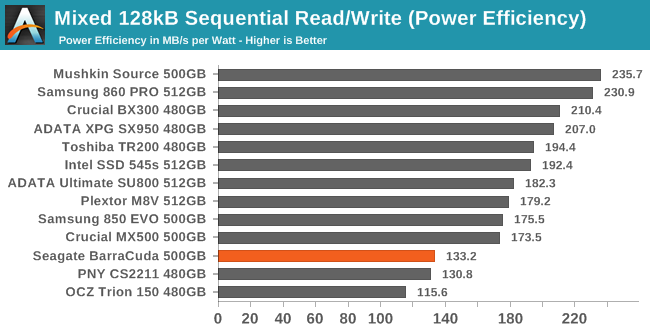
| Power Efficiency in MB/s/W | Average Power in W | ||||||||
The BarraCuda is again one of the most power-hungry drives, surpassed only by the Phison S10 SSDs that use planar NAND, so it earns one of the worst efficiency scores. The slow DRAMless SSDs at least manage to use far less power during this test, so they end up with pretty good efficiency scores.
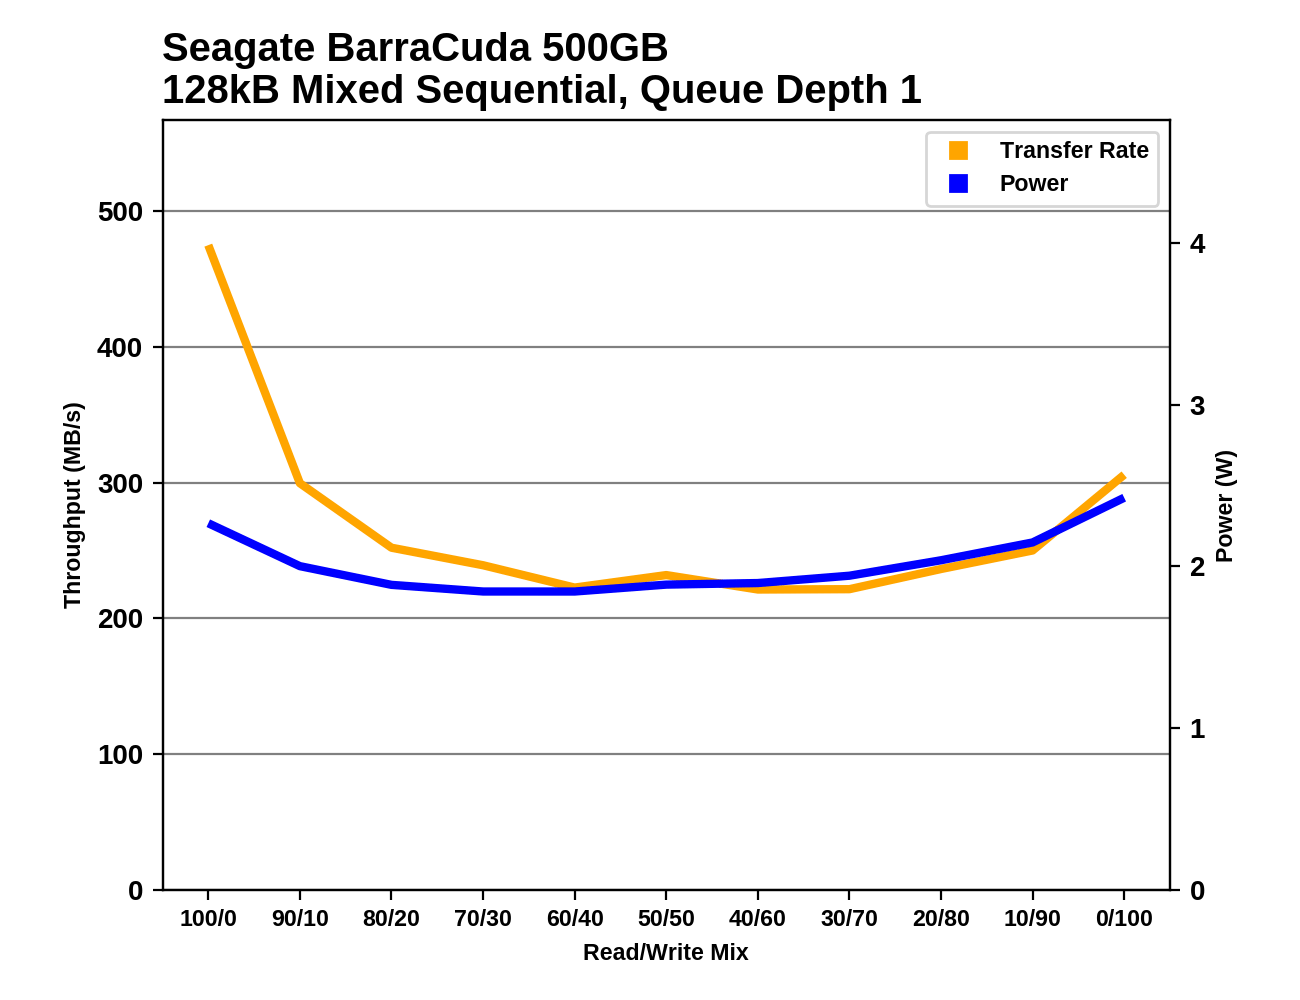 |
|||||||||
The BarraCuda starts off with great sequential read performance, but as soon as writes are added to the mix, throughput plummets. It stays slow through most of the test, recovering only slightly toward the end to deliver just over 300MB/s on pure writes. That final write speed isn't too bad, but most mainstream drives spend the read-heavy half of the test performing well above that level, instead of below 250MB/s.
Idle Power Measurement
SATA SSDs are tested with SATA link power management disabled to measure their active idle power draw, and with it enabled for the deeper idle power consumption score and the idle wake-up latency test. Our testbed, like any ordinary desktop system, cannot trigger the deepest DevSleep idle state.
Idle power management for NVMe SSDs is far more complicated than for SATA SSDs. NVMe SSDs can support several different idle power states, and through the Autonomous Power State Transition (APST) feature the operating system can set a drive's policy for when to drop down to a lower power state. There is typically a tradeoff in that lower-power states take longer to enter and wake up from, so the choice about what power states to use may differ for desktop and notebooks.
We report two idle power measurements. Active idle is representative of a typical desktop, where none of the advanced PCIe link or NVMe power saving features are enabled and the drive is immediately ready to process new commands. The idle power consumption metric is measured with PCIe Active State Power Management L1.2 state enabled and NVMe APST enabled if supported.
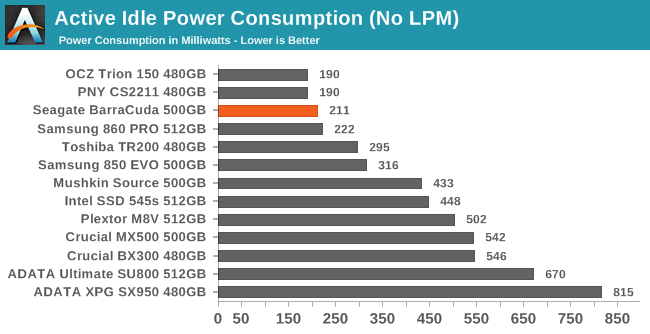
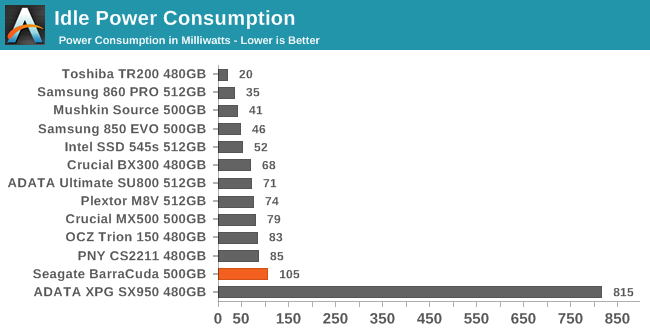
The active idle power consumption of the Phison S10 controller has always been pretty good, though the Seagate BarraCuda draws a bit more at idle than some of the older S10 drives we've tested. When SATA link power management is enabled and the drive is put to sleep, the BarraCuda's power consumption is only cut in half and every other drive with working power management comes out ahead.
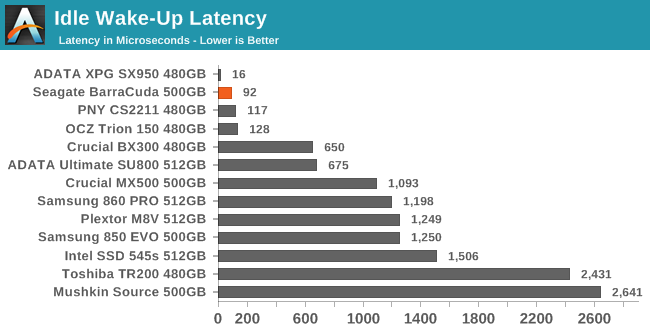
The Seagate BarraCuda had relatively poor idle power management, so it's appropriate for it to have one of the quickest wake-up latencies, slightly faster than the two older Phison S10 drives featured here. The BarraCuda wakes up seven times faster than the fastest Silicon Motion-based drive, and 26 times faster than the Toshiba TR200 that uses Phison's DRAMless S11 controller. The BarraCuda should definitely be used with the OS configured for the most aggressive drive power management, because the performance impact is minimal.
Conclusion
Seagate's return to the consumer market doesn't make much of a splash. The most remarkable thing about the Seagate BarraCuda is that it gets by with such an old SSD controller.
Overall, it's a surprisingly good showing for a drive with a controller that first hit the retail market four years ago.
The Phison S10 controller had a very forward-looking design, with support for 2TB capacities planned from the start despite that much flash being almost unthinkably expensive in the era of 19nm planar MLC. The quad-core CPU has come in handy in recent generations as the market has moved to TLC NAND that generally requires SLC write caches to offer the best performance.
However, the S10 controller is not fully up to the task of competing against more modern controllers. The Plextor M8V serves as a useful point of comparison; it uses the same Toshiba 3D TLC as the BarraCuda but pairs it with the Silicon Motion SM2258 that we usually find used with Intel/Micron flash. The SM2258 is a four-channel controller compared to the 8 channels on the Phison S10, but the Plextor M8V's performance surpasses the Seagate BarraCuda more often than not.
The limitations of the 6Gbps SATA interface have been a strong equalizing force, requiring SSDs to improve in ways other than top-line throughput numbers. Most notably, power efficiency has continued to improve in the years since the Phison S10 debuted. The Seagate BarraCuda enjoys some of those benefits thanks to its use of modern 3D TLC NAND, but it doesn't come close to the efficiency of drives with modern controllers and lower-power DRAM.
There are some bright spots in the BarraCuda's performance profile. It handles a heavy write load about as well as any SATA SSD, with no significant performance drop from SLC cache running out during continuous sequential writes. Sequential read performance is fine as well. But the Phison S10 has always struggled with mixed read/write workloads, and 3D NAND doesn't change that. On real-world tasks, the BarraCuda is clearly slower than its competition, and ends up being more comparable to the best-case performance we see from DRAMless SSDs.
| SATA SSD Price Comparison | ||||
| 250GB | 500GB | 1TB | 2TB | |
| Seagate Barracuda | $52.99 (21¢/GB) | $84.99 (17¢/GB) | $149.99 (15¢/GB) | $349.99 (17¢/GB) |
| Samsung 860 EVO | $53.99 (22¢/GB) | $72.99 (15¢/GB) | $149.99 (15¢/GB) | $299.99 (15¢/GB) |
| WD Blue 3D NAND | $52.99 (21¢/GB) | $79.99 (16¢/GB) | $144.98 (14¢/GB) | $357.49 (18¢/GB) |
| Crucial MX500 | $52.99 (21¢/GB) | $72.99 (15¢/GB) | $134.99 (13¢/GB) | $289.99 (14¢/GB) |
Now that the big Black Friday/Cyber Monday sales are over, SSD prices have gone back up by a few dollars here and there, and drives that went out of stock are starting to become available again. The major competitors to the Seagate BarraCuda that also offer capacities up to 2TB are the Samsung 860 EVO, WD Blue, and Crucial MX500. All offer higher performance and better power efficiency than the BarraCuda, and their prices are mostly equal to or slightly lower than the BarraCuda. Seagate is pricing the BarraCuda like a mainstream SATA drive, but it can't really keep pace with the competitors that use current-generation flash and current-generation controllers.
There aren't any serious problems with the Seagate BarraCuda, especially for desktop usage where power efficiency is not a priority. But unless it can offer a significant discount relative to other mainstream TLC SATA SSDs, there's no reason to consider buying it.
Where does Seagate go from here?
Unlike rival Western Digital, Seagate missed their chance at full vertical integration of the SSD side of the business. Seagate did invest $1.27 billion in Toshiba Memory Corporation as part of the consortium that acquired it from from its cash-strapped parent company, but Seagate had to agree not to acquire any voting interest or governance rights in Toshiba Memory during the next decade. Still, Toshiba has been Seagate's primary NAND supplier for quite a while and that will continue to be the case for the foreseeable future.
That makes Phison the natural choice of supplier for consumer SSD controllers. Phison has a close relationship with Toshiba and almost all Phison-based SSDs use Toshiba NAND. For the Seagate BarraCuda SSD specifically, the decision to partner with Phison may not have been the best option, but if Seagate is serious about staying in the consumer SSD market then a Phison partnership is clearly the easiest way for them to develop a full product portfolio. Phison's latest generation of NVMe controllers have been pretty good, and they have a successor to the S10 SATA controller that will be ready soon.
In order to be a top-tier competitor in the consumer SSD space, Seagate will have to be able to consistently differentiate their products from the competition. A Phison-based product line makes that pretty difficult, since there are dozens of brands selling very similar products. Seagate's acquisition of controller vendor SandForce offered some hope that they could bring to market products with custom in-house controllers, but several years later all we've seen is the recent introduction of an enterprise SATA SSD with transparent compression bearing SandForce's DuraWrite trademark.
Seagate has re-entered the consumer SSD market after a long absence, but they face an uphill battle to establish a serious presence.


